
Retail people counting measures store entries and exits. Combine those counts with point-of-sale transactions to calculate conversion, and use the right zone sensors to understand movement and dwell. This 2026 guide explains how to choose a sensor, validate accuracy, protect customer data and turn foot traffic analytics into practical store decisions.
- What Is People Counting in Retail?
- How Does a People Counting Sensor Work?
- Choosing a Counting Technology
- Why Foot Traffic Data Matters for Retail
- 5 Ways to Turn Foot Traffic Data into Action
- How to Calculate & Improve Your Retail Conversion Rate
- CCTV People Counting: Review the Data Flow
- People Counting & GDPR: Privacy by Design
- ROI of People Counting & Why Vendor Support Matters
- How to Choose the Right People Counting System
- Frequently Asked Questions

For the hardware side of this — sensor types, mounting, calibration and pricing — see our buyer guide to choosing a retail foot traffic counter.
For the reporting side — what the numbers mean, which KPIs matter and how store data becomes a decision — see our retail store analytics page.
To see how store teams read these numbers week to week, start with our guide to retail traffic counting. To see the platform behind the data, visit V-Count’s retail people counting software.
What Is People Counting in Retail?
People counting, also called footfall counting or visitor counting, measures people crossing a defined entrance or moving within a configured zone. Entrance counts show visit volume and busy periods. With the appropriate sensors and analytics, retailers can also measure occupancy, zone dwell, queues, demographic estimates and storefront capture rate. The required model, placement and licences depend on the measurement.
A count normally represents a visit or crossing, not a named or unique shopper. A returning visitor may be counted again. Define staff exclusion, groups, children and re-entry rules before using the data to compare stores or calculate conversion.
How Does a People Counting Sensor Work?
A people counting sensor detects crossings or movement in a defined field of view. The sensing technology and processing method vary by model. For a retail entrance using Nano AI, the measurement process is:
Detect: Nano AI uses 3D stereo vision and onboard AI to detect people.
Count: The configured counting line determines entries and exits.
Report: Numerical traffic data is sent to BoostBI, where it can be compared with transaction data and reporting periods.
Act: Store managers use the resulting patterns to plan staffing and test changes. Zone heatmaps and dwell require a deployment designed for those measurements.
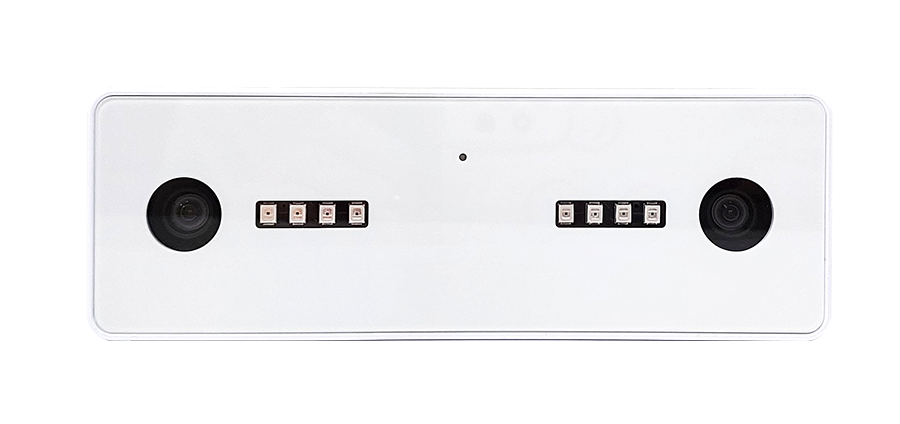
V-Count Nano AI: Up to 99% Counting Accuracy
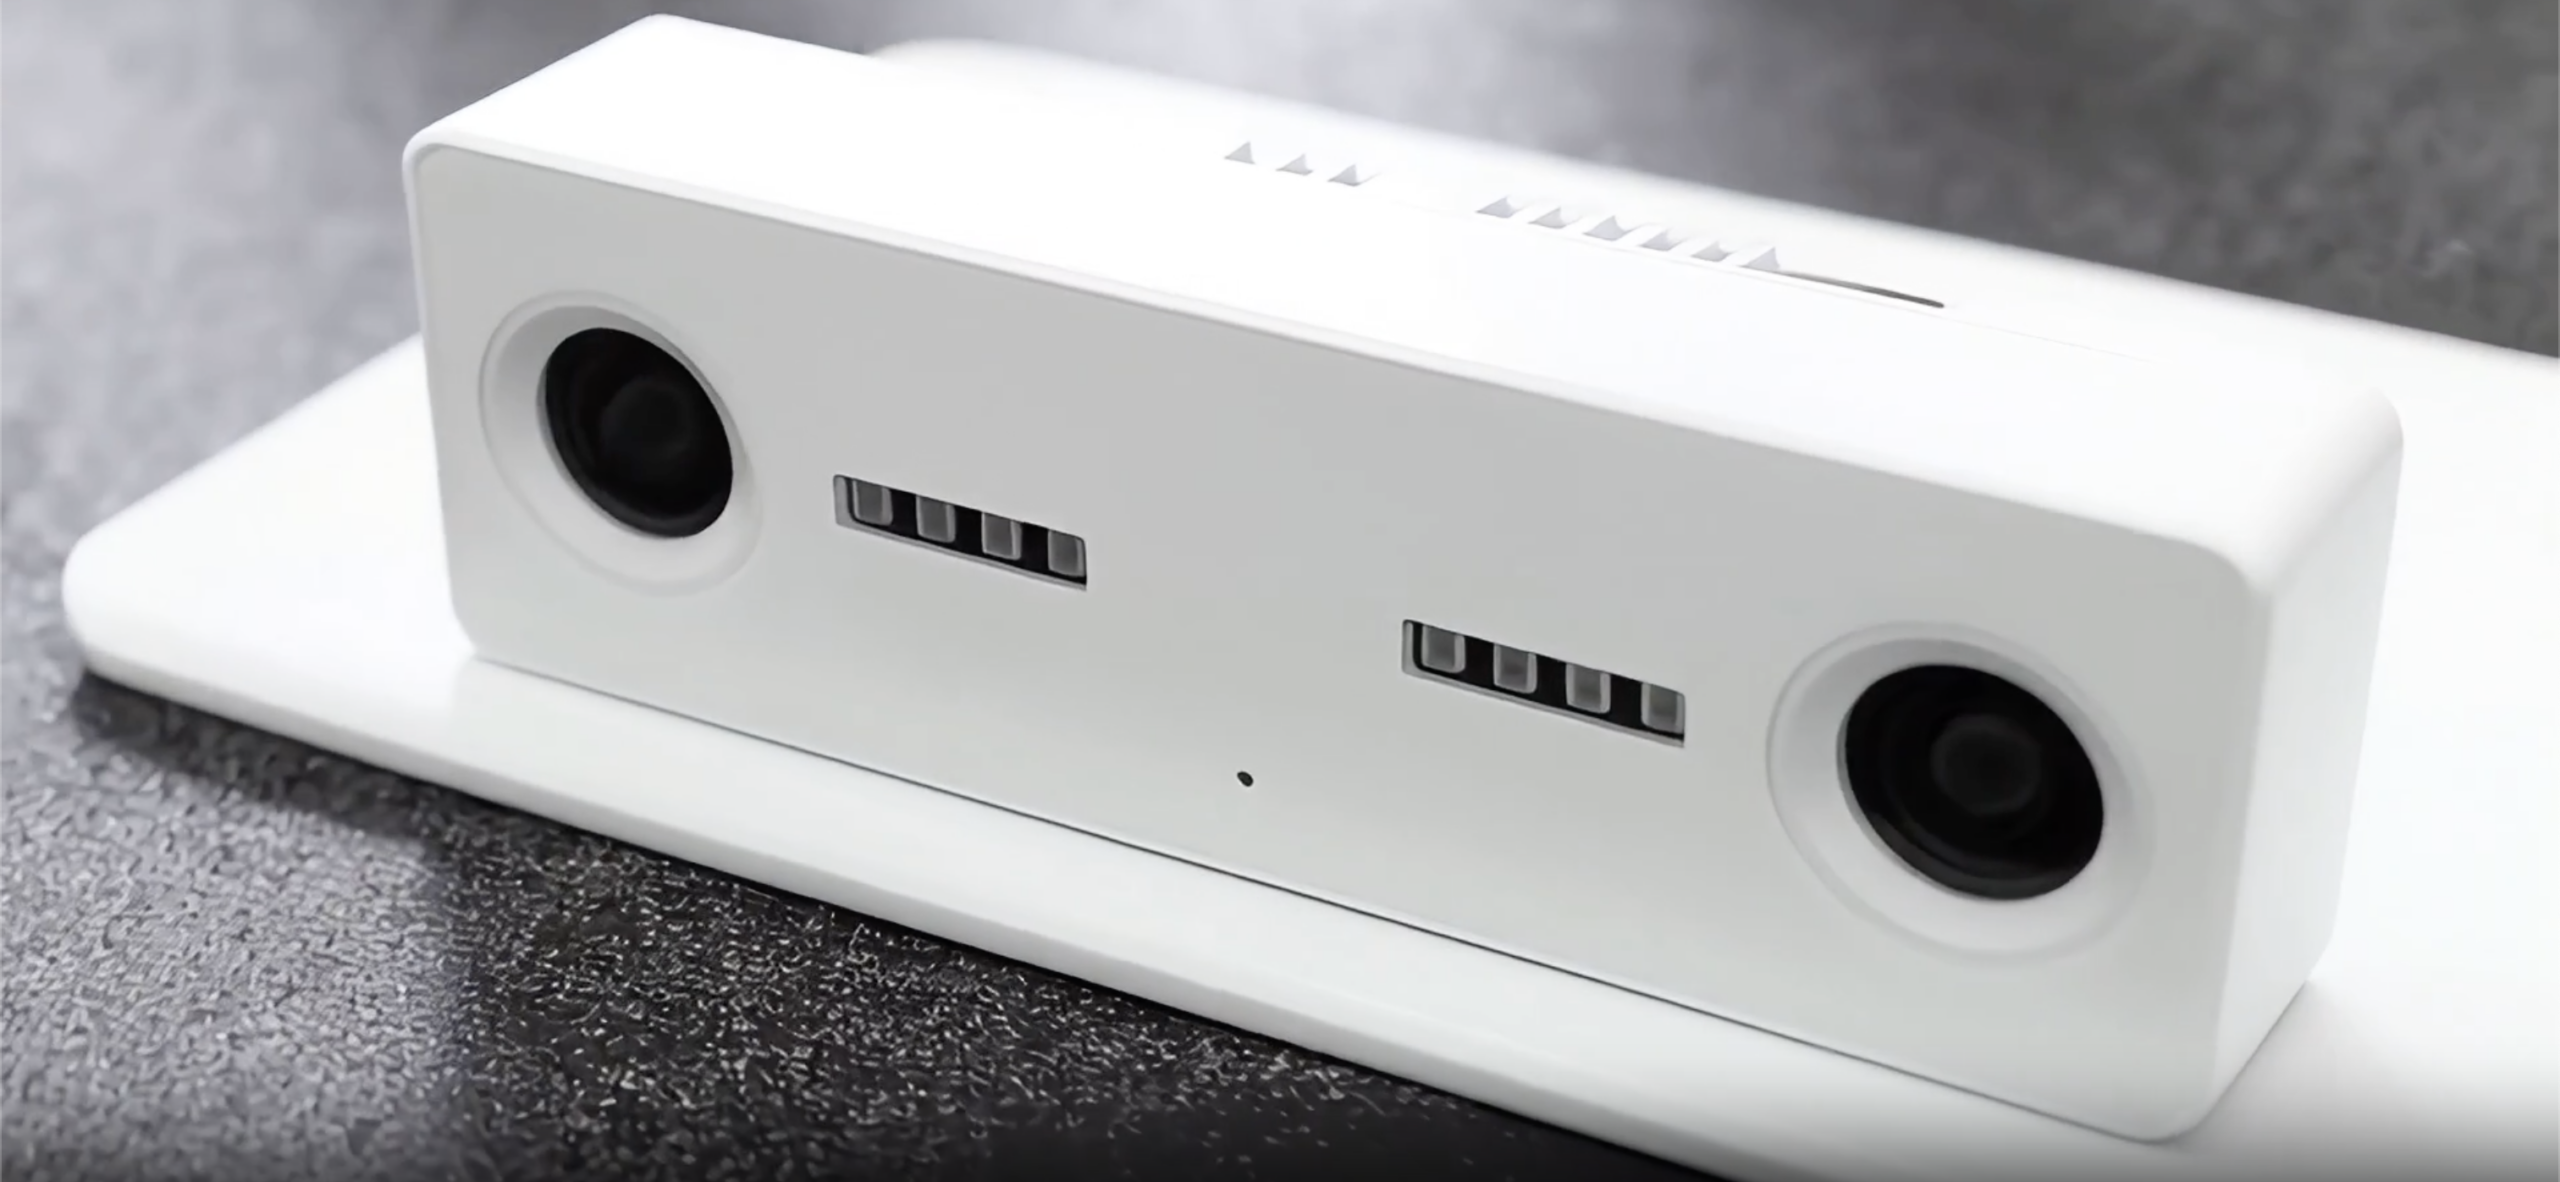
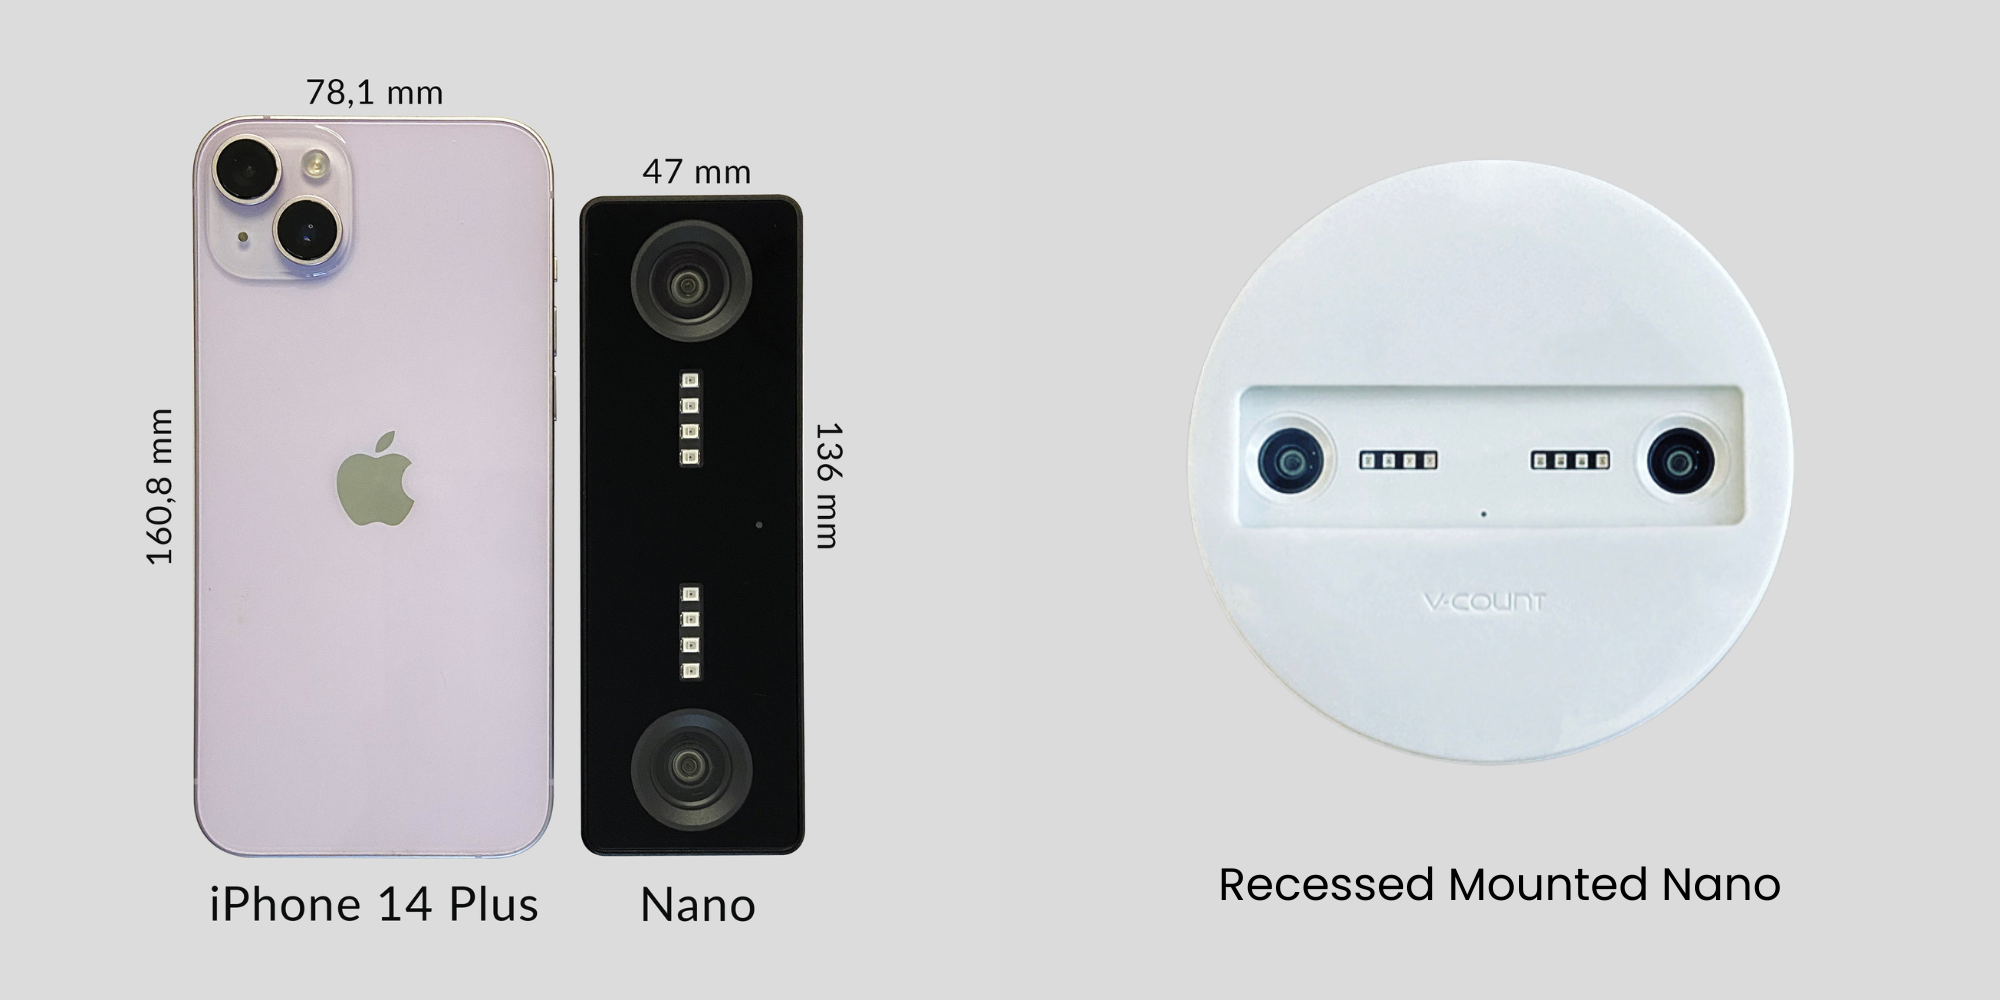
Nano AI delivers up to 99% accuracy in people counting. Its approved mounting range is 2.2–7 m, and built-in IR LEDs support counting in 0 lux total darkness. USB-C power and Wi-Fi connectivity support compact installations. Validate the proposed height, entrance coverage, traffic patterns and enabled functions during commissioning; a counting specification does not establish demographic or queue accuracy.
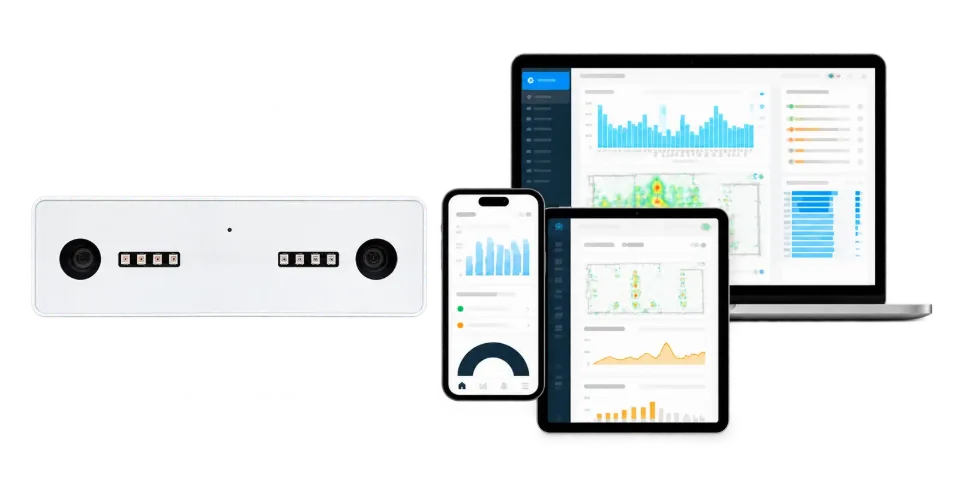
Count every visitor with up to 99% accuracy
Nano AI is a 3D people counting sensor. It counts entries and exits, can exclude staff and works in total darkness.
- Up to 99% accurate
- Staff exclusion
- Works at 0 lux
Choosing a Counting Technology for Your Store
A technology name is not an accuracy guarantee: judge each method by what it measures in your own store conditions. For a side-by-side look at infrared beam, thermal, Wi-Fi, time-of-flight and 3D stereo counters, compare people counting technologies in our dedicated guide. For most retail entrances, the choice comes down to two V-Count sensors.
Nano AI and Nano Prime: Choose by Measurement
| Measurement or specification | Nano AI | Nano Prime |
|---|---|---|
| Main role | Entrance counts and compatible functions such as staff exclusion, demographics and queue measurement. | Wide-area zone analytics, heatmaps, dwell and visitor flow. |
| Accuracy | Up to 99% accuracy for people counting. Validate each enabled function separately. | Assess the required zone, dwell and flow outputs in the proposed deployment. |
| Installation and coverage | Approved mounting range: 2.2–7 m. Confirm entrance coverage at the selected height. | Published coverage example: 120 m² at 4.5 m height. Confirm the usable area against the floor plan. |
| Darkness | Built-in IR LEDs support counting in 0 lux total darkness. | Confirm lighting requirements for the selected zone deployment. |
| How to choose | Start with a dependable entrance count and the required customer-count rules. | Choose when the question is where visitors spend time and how zones perform. |
Product references: Nano AI and Nano Prime. Nano Prime’s coverage example is a planning reference, not a maximum mounting-height claim. Confirm coverage and performance for the selected layout.
BoostBI brings traffic and sales data into reports. Staff exclusion, demographics, API access, queues and heatmaps use selected sublicences included in the quoted BoostBI package.
CCTV People Counting: Review the Actual Data Flow
CCTV-based counting is not automatically unlawful. Where images identify people, the deployment needs an appropriate purpose, lawful basis, safeguards and transparency. Even live processing without recording can involve personal data. Check the actual configuration rather than relying on the label “AI” or “camera”. ICO guidance on video surveillance explains these responsibilities.
Ask what the device measures, where it processes data, what leaves the sensor and how the site will be tested. Compare proposed installations, not unsupported accuracy ranges for entire technology categories.
Why Foot Traffic Data Matters for Retail
Sales data tells you what sold. Foot traffic analytics adds the visit volume behind those sales, so a busy store with weak conversion can be distinguished from a store that needs more traffic. Zone and queue data help managers decide where to investigate next.
The same sales total can hide different operating problems. One store may have fewer visits and strong conversion; another may attract many visitors but struggle during peak hours. Compare traffic, conversion and average transaction value for matched periods before deciding whether to change staffing, marketing or merchandising.
Without people counting data, it is difficult to tell whether a sales change came from traffic or conversion. Use hourly counts to review staffing, compare campaign periods, and benchmark stores with similar formats and counting rules. Then test one operational change and measure the result.

What does it cost?
Sensors from US$299, paid once. BoostBI from US$9 per sensor per month.
5 Ways to Turn Foot Traffic Analytics into Store Actions
Optimize Staff Scheduling to Match Foot Traffic Peaks
Compare hourly footfall with staff availability, transactions and queue conditions. If the busiest visitor window is 11 AM–1 PM but the roster peaks later, test moving coverage into that window. Keep opening hours and promotions comparable, then review conversion, service and labour cost together.
Measure Storefront Conversion Rate (Capture Rate)
Capture rate = eligible store entries ÷ measured passing traffic × 100, using the same time period and a defined counting area. It is different from purchase conversion. Test a window display or entrance change and compare matched days; verify the sensor placement and outdoor suitability where needed. See the storefront counting and capture-rate guide.
Use Zone Heatmaps to Eliminate Dead Spots
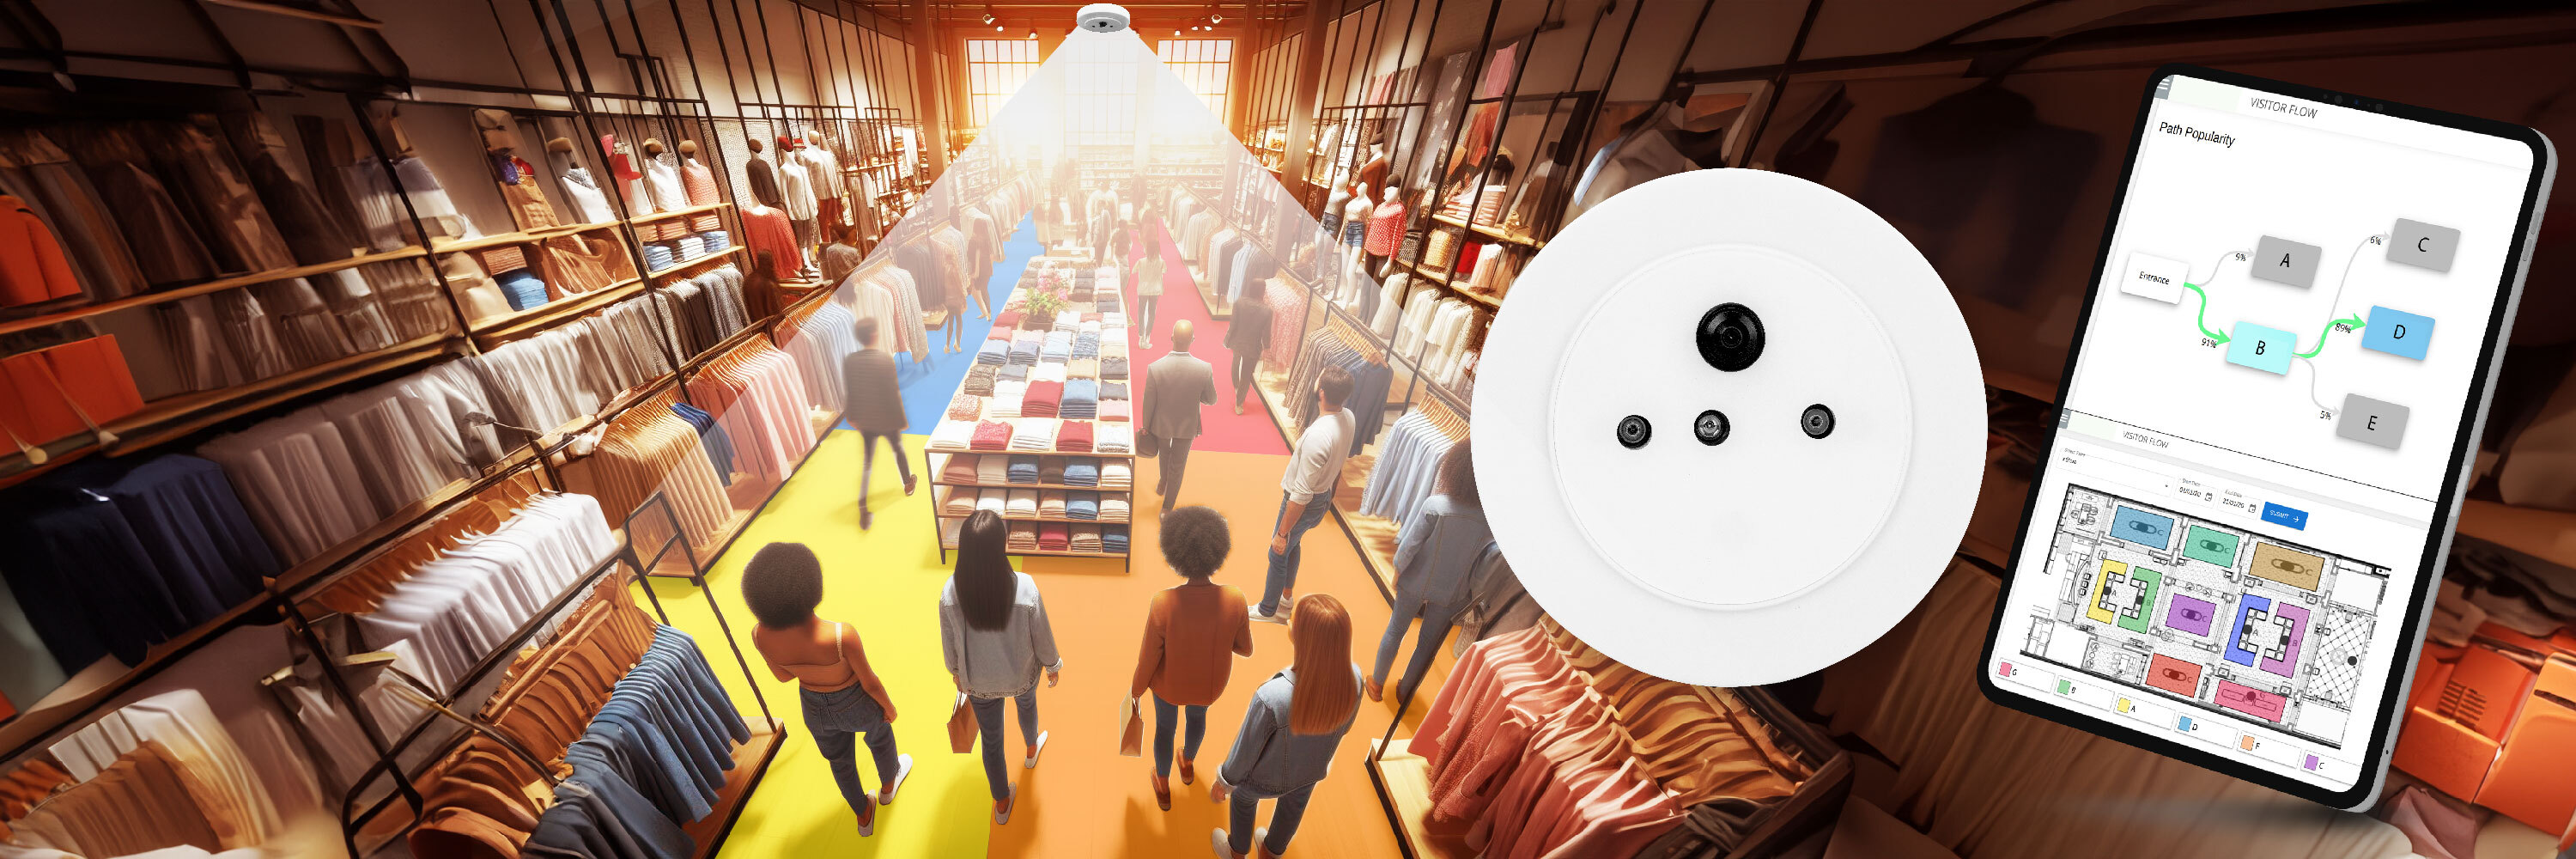
Entrance counts show how many visits occurred. Nano Prime heatmaps, zone counts and dwell data help show which areas attract attention. Test a product move or layout change, then compare zone traffic, dwell and category sales. A heatmap shows measured activity; it does not by itself reveal purchase intent or explain why someone did not buy. Explore heatmap and zone analytics.

Reduce Queue Abandonment with Real-Time Alerts
Use queue measurement to identify long-wait periods and set a response plan. Confirm that the selected Nano AI placement, queue licence and alert configuration fit the checkout area. Compare waiting time and completed transactions before and after changing cover, with similar traffic conditions; the result depends on the action taken.
Connect Online Marketing Spend to In-Store Visits
Compare footfall before, during and after a campaign, allowing for day of week, opening hours, promotions and local events. Use matched stores or periods where possible. A traffic increase during a campaign is a useful signal, but timing alone does not prove that the campaign caused the visits or identify which customer saw an advertisement.
A Weekly Review for Store Managers
| Observed pattern | Check next | Action to test |
|---|---|---|
| Traffic grows; conversion falls | Peak-hour cover, stock availability, queues and counting consistency. | Change coverage in the affected hours and compare matched periods. |
| Similar traffic; different store sales | Conversion, average transaction value, assortment and store format. | Test a relevant practice from a comparable stronger store. |
| A zone attracts dwell but weak sales | Category transactions, availability and product placement. | Change one display or availability issue and reassess. |
| A campaign coincides with more visits | Seasonality, other promotions and a suitable comparison group. | Repeat with a controlled comparison before reallocating budget. |
BoostBI’s AI Sales Coach provides weekly coaching tailored to each store’s data. Use the recommendations to choose an action, assign an owner and review the next comparable period. The reports support decisions; improvement is measured after the team acts.
How to Calculate & Improve Your Retail Conversion Rate
For store reporting, retail conversion rate = qualifying purchase transactions ÷ eligible visits × 100. Use the same store and reporting period for both. This is a transaction-to-visit measure; anonymous footfall alone does not identify unique buyers.
220 qualifying transactions ÷ 1,000 eligible visits × 100 = 22%. Keep rules for staff, re-entry, groups, returns and collection-only visits consistent. Record which rules are supported by the deployed system and which are reporting decisions.
There is no single conversion percentage that is a useful benchmark for every retail format. Compare your own matched periods and similar stores using the same definitions. For a broader explanation, see how to measure retail conversion rate.
What Would a Three-Percentage-Point Increase Be Worth?
Scenario: assume 1,000 eligible visits every day, conversion rising from 22% to 25%, an unchanged $45 average transaction value, and a month with 30 trading days.
| Step | Calculation | Result |
|---|---|---|
| Conversion increase | 25% − 22% | 3 percentage points (0.03) |
| Additional daily transactions | 1,000 × 0.03 | 30 |
| Additional daily revenue | 30 × $45 | $1,350 per day |
| Additional monthly revenue | $1,350 × 30 trading days | $40,500 per 30-day month |
This is additional revenue, not profit or system ROI. For a business case, apply the relevant contribution margin and subtract incremental operating costs and system costs. Change the traffic, conversion, transaction-value and trading-day assumptions to match your store.
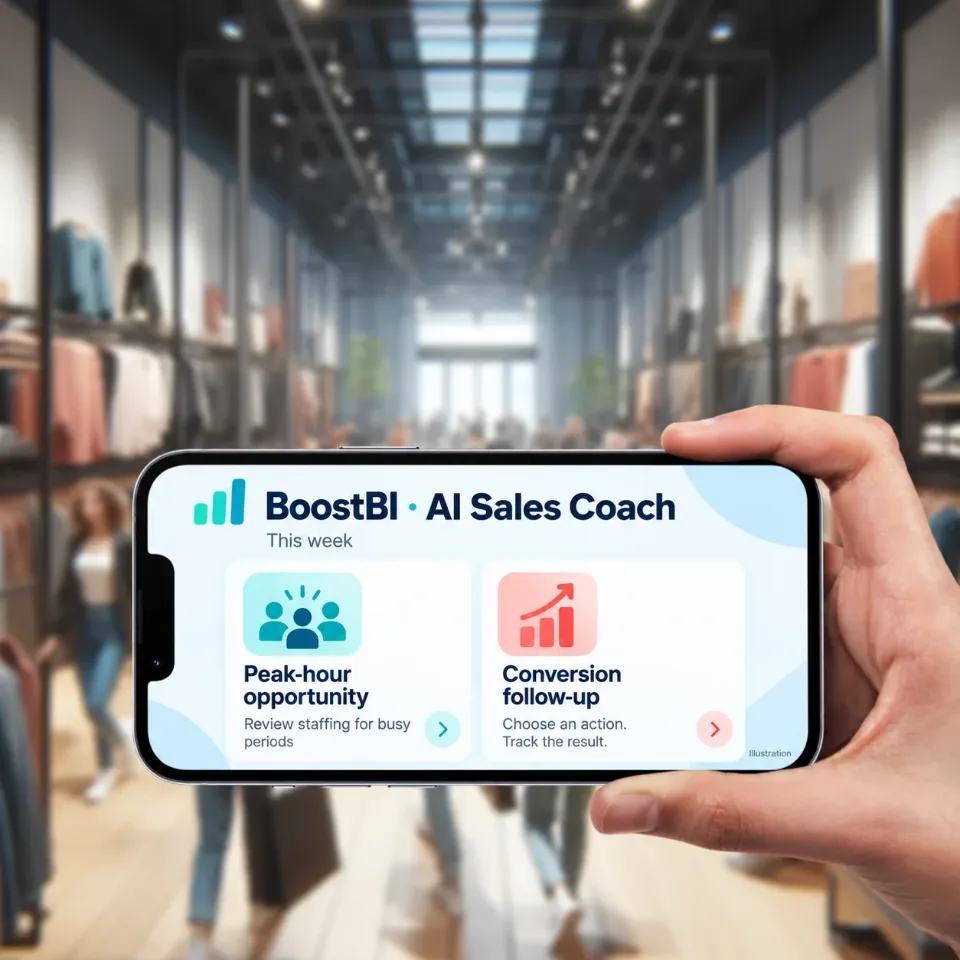
Turn foot traffic into sales
BoostBI joins visitor counts with your sales to show conversion rate, busy hours and staffing gaps.
- Conversion rate
- Staffing by hour
- AI Sales Coach
People Counting & GDPR: Privacy by Design
V-Count describes Nano AI as using on-device processing and sending non-identifiable insights rather than recording or transferring identifiable images. Nano Prime also describes on-device processing with non-identifiable outputs. Document this data flow for the models, functions and integrations in your deployment.
Confirm what is analysed on the device and what data is output.
Record what BoostBI receives and whether connected systems add identifiable information.
Set appropriate access, retention and security controls.
Have the responsible privacy team assess the actual use and applicable requirements.
The European Data Protection Board’s video-device guidance distinguishes data that can identify people from data that cannot. An anonymous report does not establish that every preceding processing step is outside data-protection law.
Where personal data is processed, the retailer and suppliers should document their roles, purpose, lawful basis, notices, access, retention and applicable processor arrangements. Assess whether a data protection impact assessment is required, including for relevant large-scale systematic monitoring.
Review demographic, staff-related and linked POS functions as part of the same deployment. Compliance with GDPR, CCPA or another framework depends on the actual processing and jurisdiction; a sensor purchase does not certify the whole installation.
ROI of People Counting & Why Vendor Support Matters
Build the business case from your own baseline. Count hardware, installation, connectivity, integration, subscription and ongoing support costs. Estimate benefits from measured operational changes, then check whether they exceed the costs. Payback varies by store and execution.
Calculate Payback from Net Benefit
One-time deployment cost ÷ positive monthly net benefit = estimated payback in months. Monthly net benefit includes incremental contribution and verified cost savings, less recurring system and operating costs. If the net benefit is zero or negative, this calculation does not show a payback period.
Use conservative, expected and optimistic scenarios, and check them against a pilot. Avoid counting the same improvement twice, such as treating both extra sales and the full value of extra transactions as separate benefits.
Review the Subscription and Support Terms
V-Count prices sensor hardware separately from BoostBI. The approved BoostBI range is $9–$49 per sensor per month, depending on the selected sublicences. API access, staff exclusion, demographics, queues and heatmaps are selected functions included within the quoted package.
A subscription alone does not prove support quality. Compare calibration assistance, response times, updates, data export and hardware coverage in writing. The Nano AI product page ties its lifetime hardware warranty to the VIP subscription option.
Request a deployment and pricing discussion using your store count, entrance dimensions, required analytics and existing POS system.
Not sure where the sensors go?
Send a floor plan and a few photos taken by your store manager. We recommend sensor placement within 24 hours.
How to Choose the Right People Counting System
Select a system against your store conditions and business questions. The footfall counting software buyer guide provides a vendor shortlist; the checks below help validate the proposed installation.
Test accuracy under agreed conditions. Record the sensor model, firmware, mounting height, entrance width, lighting, traffic volume and counting-line setup. Include quiet and peak periods, groups, side-by-side crossings, children, re-entry and staff movements relevant to the store. Report results by scenario and direction, not only one pooled percentage.
Validate the required output. Compare entrance counts against an independently recorded manual reference using the same rules. Evaluate staff exclusion separately from total crossings. Check demographic, queue and zone measurements with suitable reference observations; entrance-count accuracy is not a specification for every analytic.
Review the data flow. Confirm sensor outputs, platform storage, access permissions and connected-system data before rollout. Have the responsible team approve the deployment’s privacy arrangements.
Reconcile the data. Check POS transaction definitions, time zones, trading hours and missing intervals. Confirm which integrations are included and which require configuration or API work.
Agree acceptance and support. Define the required performance, minimum observation sample and sign-off process before the pilot. Record failures and retest after changes to placement or calibration. Confirm who will investigate unexpected data after launch.
For each non-zero reference interval, calculate absolute count error (%) = |sensor count − reference count| ÷ reference count × 100. Compare entries and exits separately. Summarise the absolute errors across matched intervals so overcounts and undercounts do not cancel. Report false counts during zero-traffic intervals separately. This is a proposed acceptance method, not a published V-Count test result; agree the method with the supplier before comparing quoted accuracy figures.
Frequently Asked Questions About People Counting
What is retail traffic analytics?
Retail traffic analytics is the analysis of store visits: how many people enter, when, how long they stay and how many buy. V-Count provides retail traffic analytics with Nano AI sensors (up to 99% accuracy) and BoostBI, which reports traffic by hour and store, joins it with sales for conversion rate, and adds occupancy, capture rate and zone heatmaps. For the measurement side, see how to measure foot traffic.
What is a people counting sensor and how does it work in retail environments?
V-Count’s Nano AI is a 3D Active Stereo Vision sensor that counts entries and exits at up to 99% accuracy, processes on the device and sends counts to the BoostBI platform. A people counting sensor detects entries, exits or movement within a configured area and produces counts for analysis.
V-Count Nano AI uses 3D stereo vision and onboard AI for people counting. Nano Prime supports wide-area zone traffic, heatmaps and dwell analysis. The model, placement, counting rules and selected licences determine the outputs available; entrance visits are not automatically unique shoppers.
What are the best implementations for people counting sensors in retail?
With V-Count, you send a floor plan and photos taken by the store manager, and V-Count returns sensor placement advice within 24 hours. Begin with a defined business question and a representative pilot.
Cover the relevant entrances without overlapping counts, configure exclusions and compare results with a manual reference. Add zone or queue coverage only where those measurements are required. If reporting conversion, align visits and qualifying POS transactions by store and period.
Agree acceptance criteria, data-gap handling and support before expanding to more locations. For a V-Count rollout, scope Nano AI, Nano Prime and the selected BoostBI functions around those requirements.
What is foot traffic analytics?
Foot traffic analytics is the measurement and analysis of how many people visit a store, when they arrive, how long they stay and how many of them buy. V-Count provides foot traffic analytics with Nano AI people counting sensors (up to 99% accuracy) at the entrance and BoostBI, which reports visits by hour, day and store and joins them with POS sales to show conversion rate.
The raw counts are often called footfall data; the analytics turn them into decisions such as staffing peak hours, comparing stores fairly and measuring the effect of campaigns and window displays.
See it working in a store like yours
Book a free demo and see live traffic, conversion and staffing data. Trusted by 600+ companies in 130+ countries.