 Retail stores receive millions of visitors every year. The primary objective of a store is to attract visitors and make sales. However, this constant stream of traffic can be leveraged to create an alternate source of value for retailers. You can collect traffic data and extract key retail analytics from it. This provides insights into customer behavior and preferences, and by identifying common trends, you are better placed to maximize store traffic.
Consider this: you manage a furniture showroom, and store analytics indicate that 75% of your visitors are women. The data also shows that around 60% of your prospects visit between 10 a.m. and 3 p.m. on Saturdays. Based on this information alone, you can create a lot of sales opportunities and optimize store operations. Some retailers have constant access to such details because they actively collect and analyze store traffic data.
According to the National Retail Federation (NRF), only 47% of retail businesses leverage customer analytics, often due to a lack of fully integrated customer data or integration into other operational data. Sometimes, it is simply due to a lack of knowledge about using and leveraging such data.
Counting & Analyzing Visitor Traffic
The first step is to calculate and analyze visitor traffic data. This provides an overview of how many people visit your store, your busiest periods, and other pertinent information about your visitors.
- Peak/off-peak periods
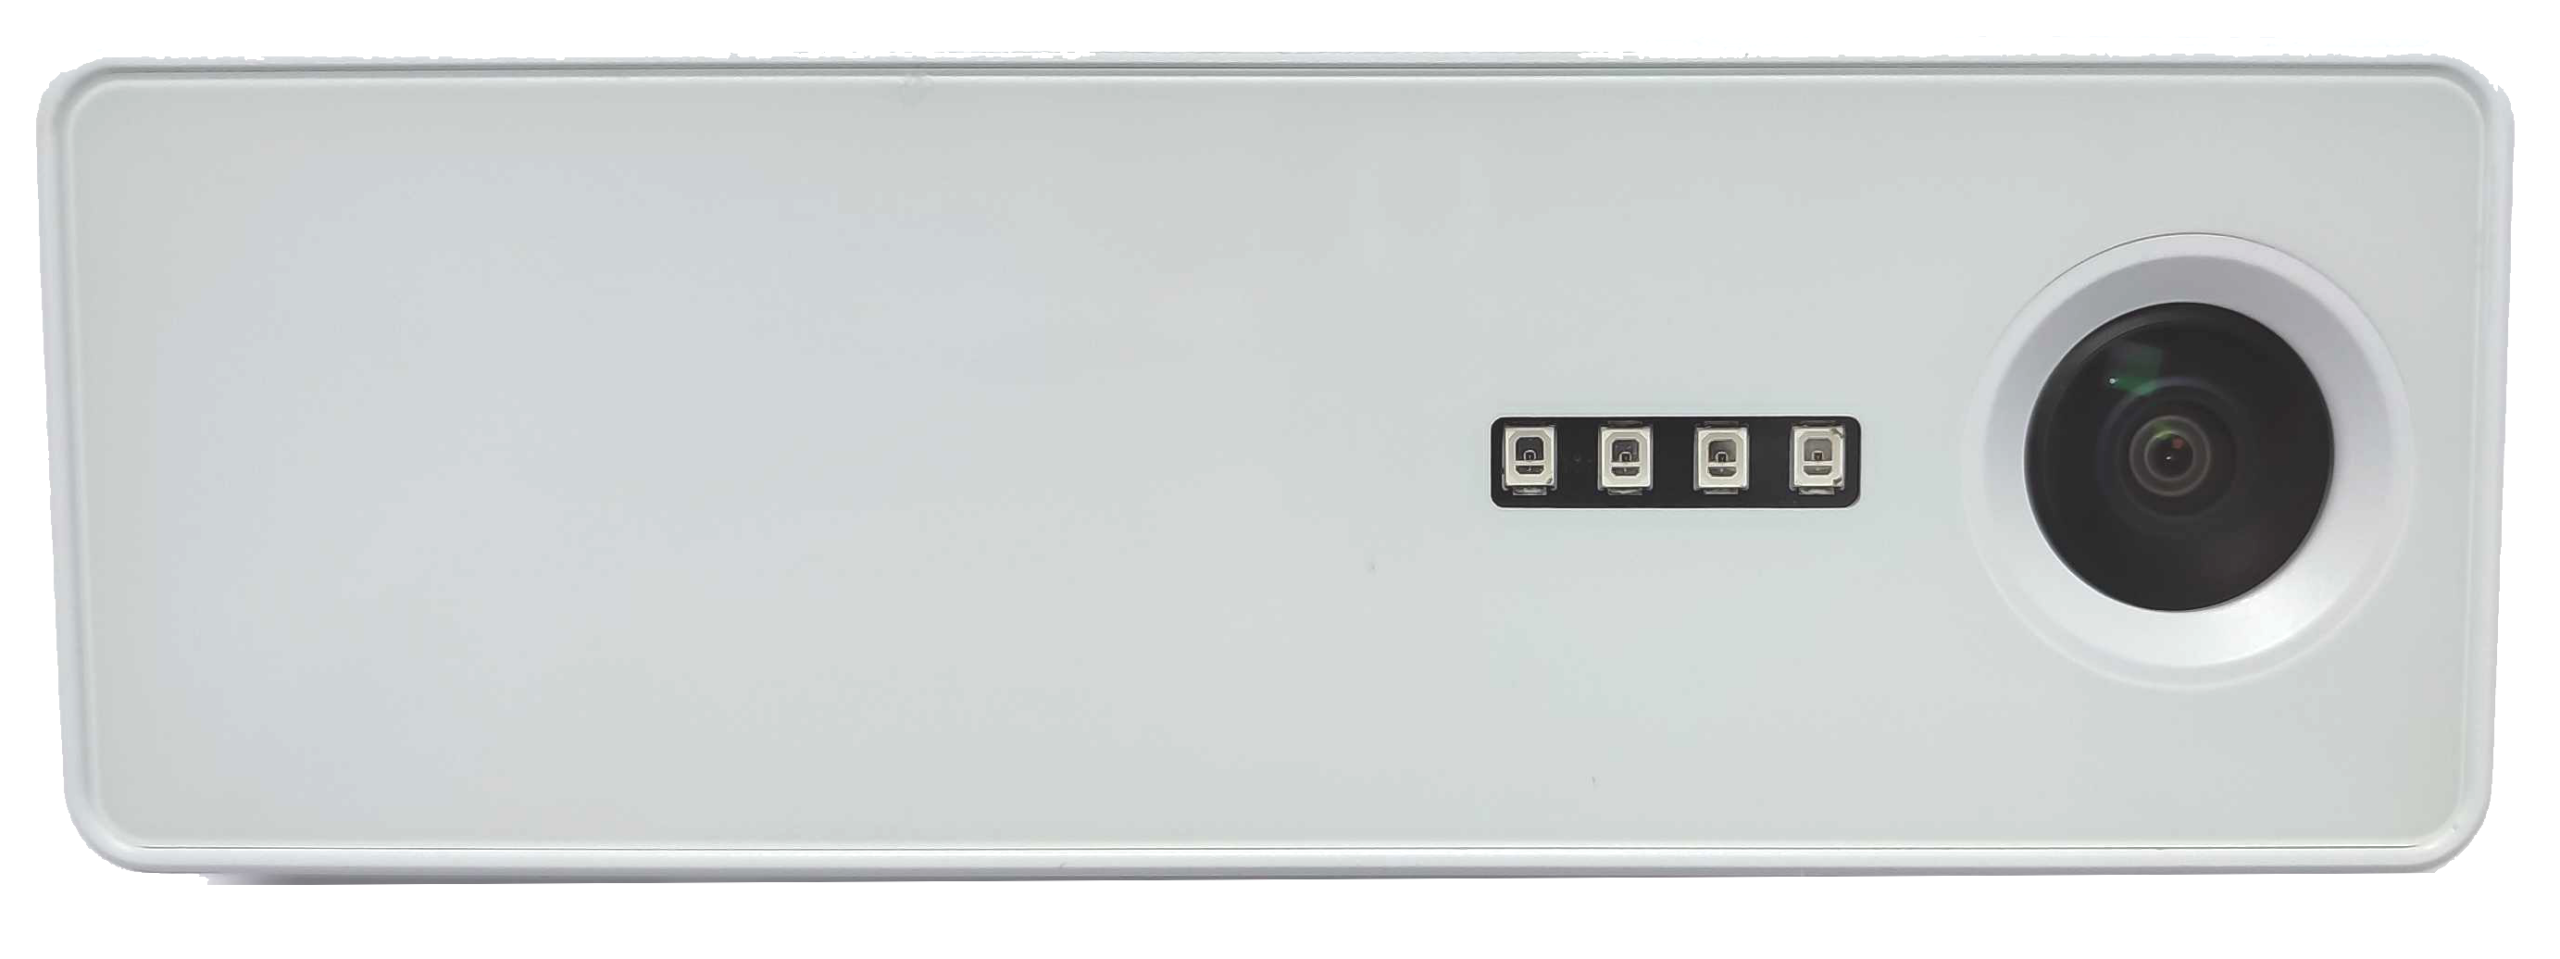
This is a crucial metric because it provides insights into customer behavior. If you know what times to expect increased visitor traffic, you can prepare accordingly and make the most of the extra footfall. Customer counting technologies are required to identify a store’s busiest periods. V-Count’s Business Intelligence Platform (BIP) analyzes historical data from our Nano AI traffic counters to determine the hours, days, or seasons that prospects are more likely to visit. - Draw-in rate
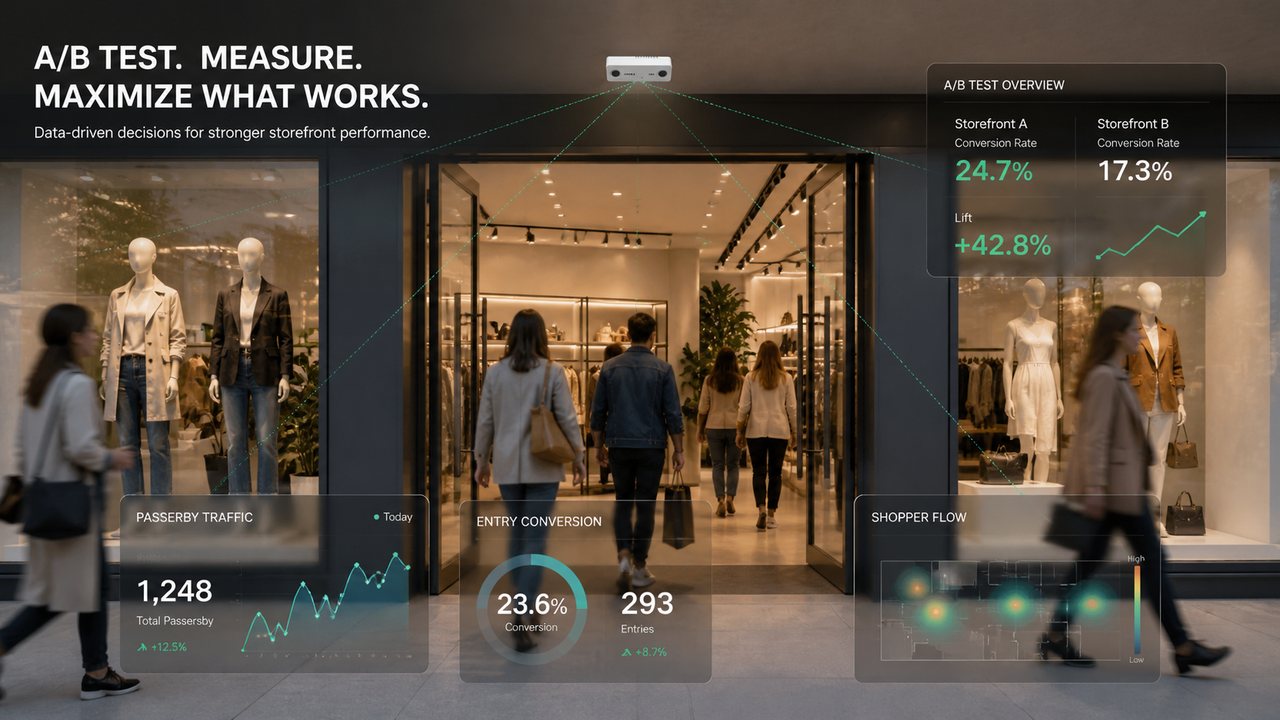
With data from Street and Customer Counters, you can determine your store’s draw-in rate. This is calculated by comparing pedestrian traffic to walk-ins. If 1000 people walk past a store and only ten people enter, that’s a draw-in rate of 1%, which is relatively low. This may indicate that the store is not attractive to pedestrians. Store managers may address this by devising strategies to boost walk-in traffic. Perhaps by improve window displays or offering discounts. - Demographic Analysis
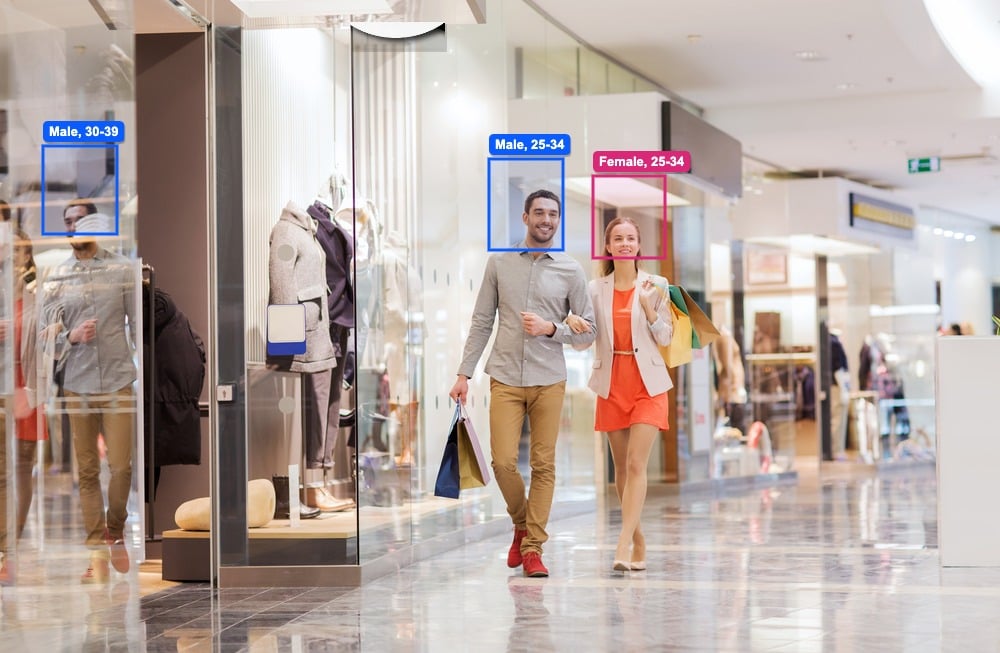
V-Count also offers retailers a Demographic Analysis solution. With this, store visitors may be separated into categories based on their ages and genders. This information can be used to optimize product listing. Say you manage a footwear store, and your traffic analytics show that young men between the ages of 18 and 23 are your prevalent customers. You need to list products that appeal to that demographic to ensure sales and better conversion rates.
Analyzing In-Store Traffic
The second part of retail traffic analysis focuses on how customers behave inside the store. By identifying behavioral patterns and customer preferences, retailers can boost sales by optimizing the buying process. You may also leverage in-store analytics to create new selling opportunities.
- Visitor flow
Zone Counting and heatmap solutions make it possible to analyze your customer’s paths through a retail location. Analytics from the software provides insights into how visitors move around within a store. It highlights busy zones and helps retailers identify bottlenecks in a customer’s journey. Bottlenecks need to be resolved, and slow products may be placed in busy zones with popular products to boost sales. - Zone traffic
Heatmap analytics can also be used to identify hot zones—the sections that see the most visitor traffic. These sections hold more sales potential than any other, making them ideal for promoting new products. You may also need to deploy more staff to these areas during peak periods to improve service and increase sales. - Average dwell-time
Retailers can leverage in-store customer tracking sensors to measure and analyze average dwell time, a metric that shows how long customers spend in a store. According to research, the longer the time a prospect spends in a store, the higher the likelihood of making a purchase. Doubling a store’s average dwell time has been shown to increase sales by up to 30%. If analytics show that customers don’t linger in your store, you must implement strategies to increase the average dwell time.
Conclusion
With retail analytics, there are numerous metrics to track, and optimizing even one metric can significantly boost business performance. It is much more effective to use retail analytics software and accurate people counting sensors to facilitate traffic data collection and analysis.