Retailers have been analyzing customer behavior and shopping trends for years, even when the technology to do so effectively didn’t exist. From short surveys that sought to understand what customers liked to manual people counting devices that measured foot traffic in retail, store managers have always recognized the importance of foot traffic analysis.
Thankfully, technological advancement has made retail analytics solutions more widespread than ever. Retail store owners and managers now have access to cutting-edge software that helps them understand how customers behave in their physical locations. They can now measure and track footfall and analyze how it impacts sales and conversion, identify trends, benchmark store performance, and optimize store operations.
Why Collecting Foot Traffic Data Matters for Retail?
Modern technologies provide valuable retail foot traffic data about customers’ favorite shopping times or days, the store sections they love spending time in, and their preferred products. Visitor traffic data can be leveraged to monitor every step of the customer journey, from customer attraction and retention to marketing and product placement. Key metrics like draw-in rate, dwell-time, cart abandonment rate, customer-to-staff ratio, and average time spent at checkout can also be monitored and improved.
Furthermore, managers gain more control over their stores and implement strategies to optimize operations. With the help of analytics, they can identify and cut out needless expenditures. They can better understand customers’ shopping experiences and are better equipped to resolve any bottlenecks in the buyer’s journey, which will ultimately improve operations and boost customer satisfaction, ensuring higher conversion and retention rates.
To this end, we have compiled a list of the best foot traffic analysis technologies on the market and how they work:
People Counting Technology
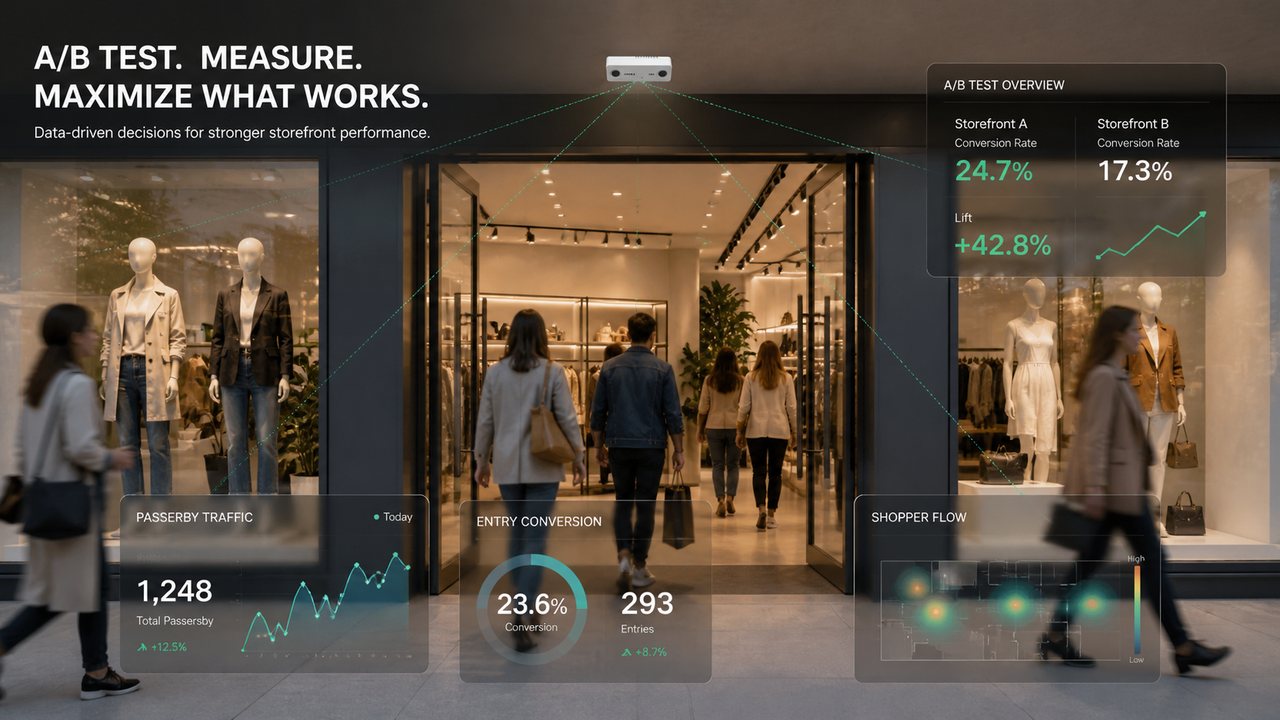
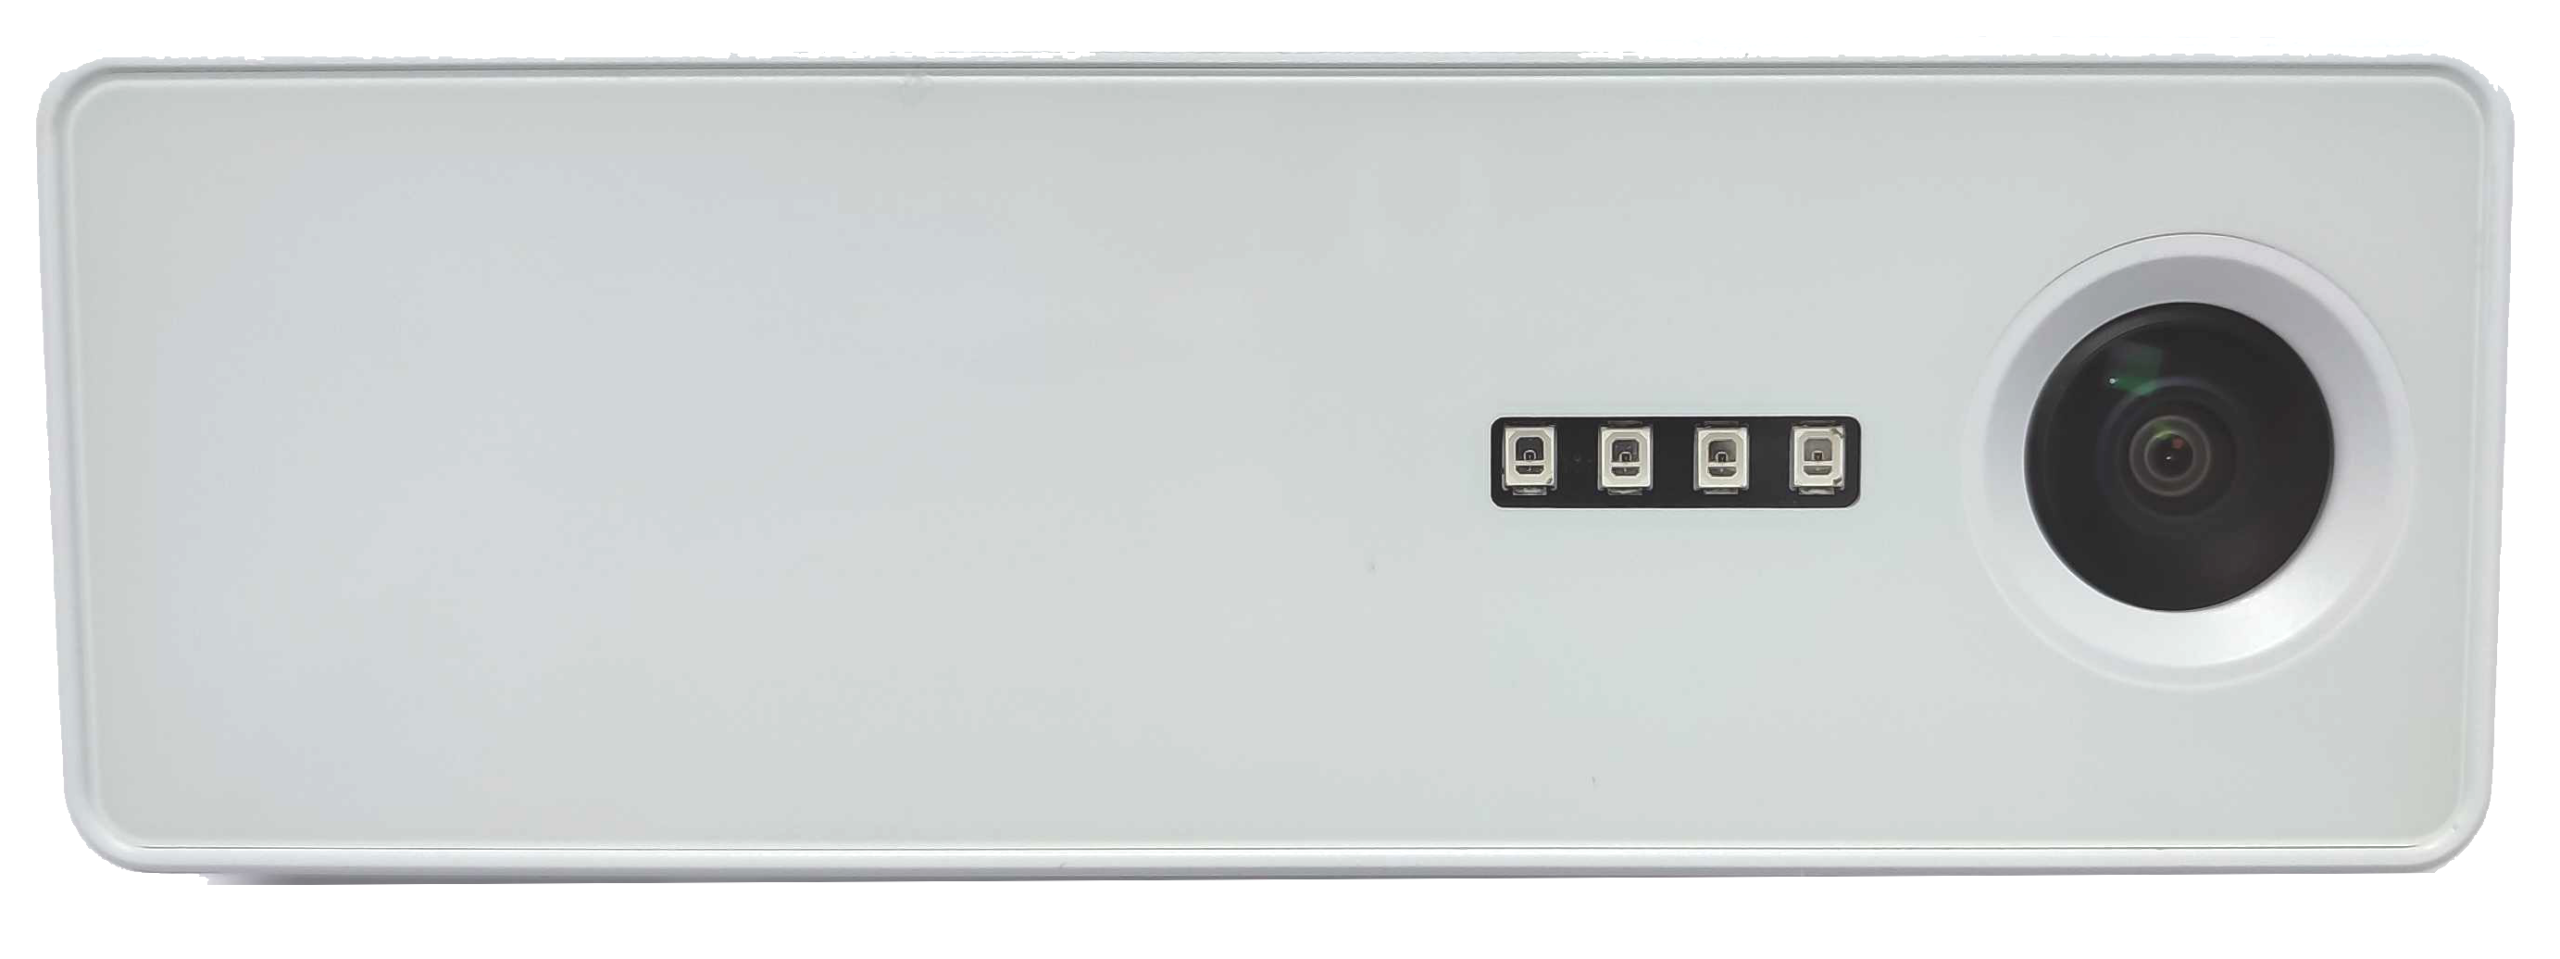
The first step to analyzing foot traffic is measuring it, and V-Count’s People Counting technology does this effectively. The data sent from our Nano AI people counter to the Business Intelligence Platform (BIP) holds a lot of insights about visitor footfall, and they can be used to derive crucial metrics for any business. For example, retailers can estimate how many visitors they receive per day, which hours are the busiest every day, and which days are the most active every week.
Furthermore, footfall data provides a means to assess the effectiveness of new marketing initiatives. Changes in visitor traffic after a promotion or campaign launch indicate how well it was received.
VCare Real-Time Occupancy
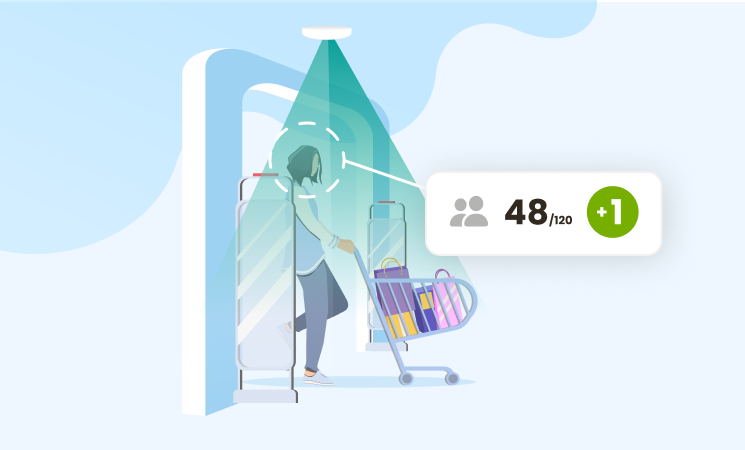
Safety has become the main concern for all customers considering going back to stores. The VCare real-time occupancy solution allows brick and mortars to count the number of in-store visitors in real-time. Store managers can communicate those numbers along with safety recommendations to customers waiting outside via digital screens. This way, businesses can follow government capacity restrictions and social distancing guidelines to ensure both customer and staff safety.
Zone Analytics
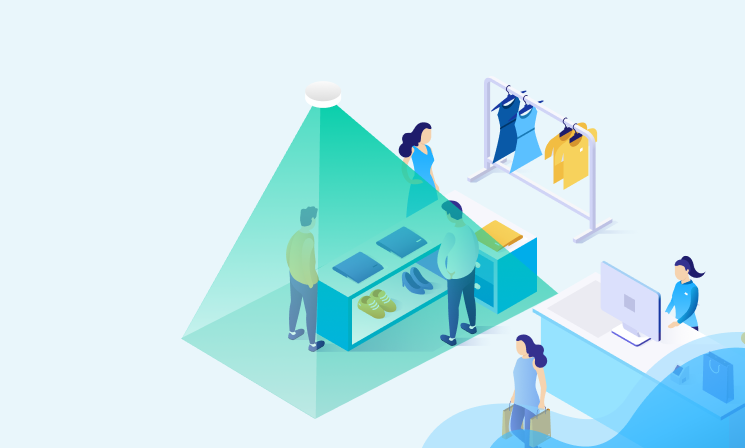
The Zone Analytics solution measures customer engagement levels and highlights how visitors move around the store. This can help retailers identify their busiest sections, their customers’ average dwell-time per zone, how customers move around the store, and the products they engage with regularly.
The visitor flow metric outlines the customers’ in-store path to purchase. It shows how easy it is for people to move around and find the products they want. If your store’s layout is too complicated and visitors struggle to find items, they’ll leave without making a purchase.
Dwell-time is another vital indicator; The longer you keep prospects in your store, the higher the chances of them making a purchase. By tracking and improving the dwell-time metric, you may increase your conversion rate.
Knowing your busiest zones and your customers’ preferred products also has another advantage. Sections that see the most traffic have the highest potential for sales; They provide an excellent avenue to boost engagement for new products and promote discount offers to customers. Unattractive products can be delisted to make room for the popular ones. Alternatively, products in both classes may be cross-sold to get the poor-performing products off the shelves.
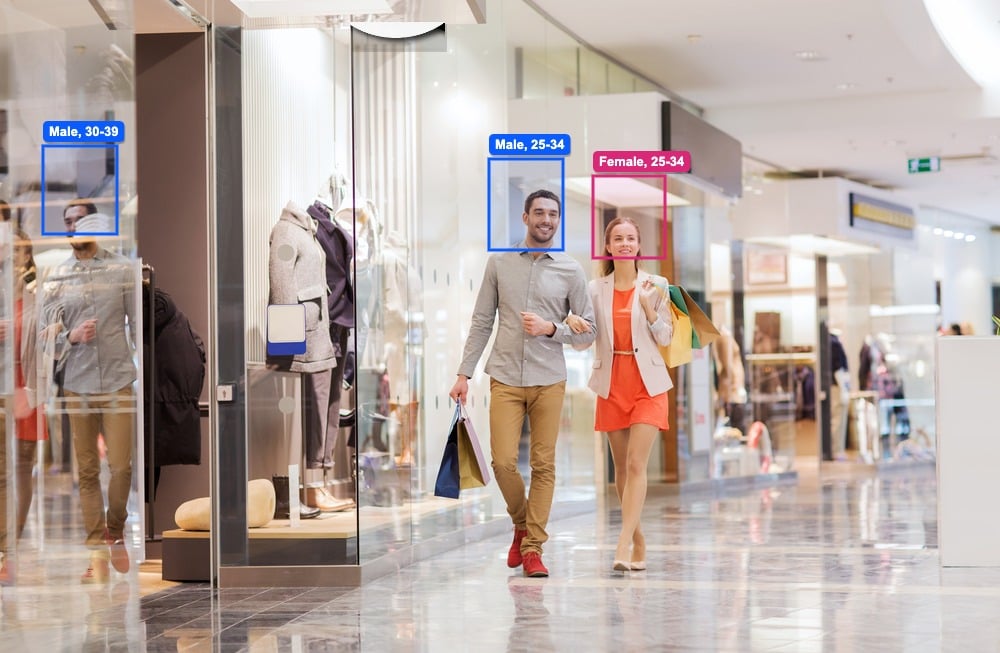
Demographic Analysis
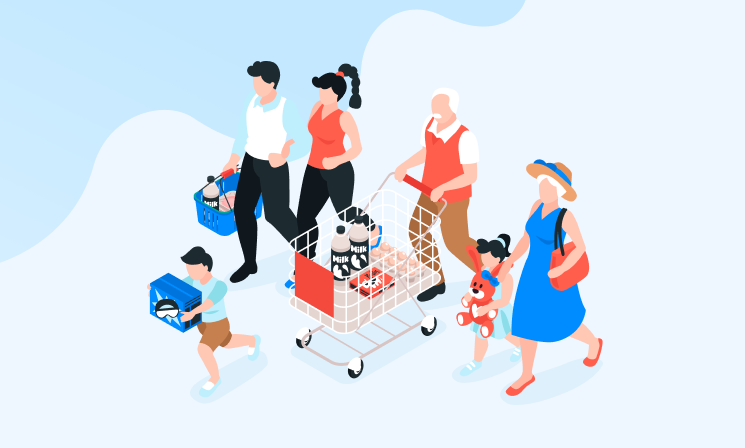
V-Count’s Demographic Analysis Technology separates store visitors into categories based on their ages and genders. Knowing your visitors’ demographic distribution makes it easier to offer them the right products and brands. You are also better placed to provide personalized services and products that keep customers engaged and increase satisfaction.
Queue Management
V-Count offers the most cutting-edge queue counting and management solution currently available in the people counting market. V-Count’s Nano AI can accurately and anonymously calculate the number of customers standing in line at the checkout, as well as the average time they spent there.
Identifying these key metrics is critical for retailers seeking to efficiently allocate their personnel and prevent potential customer or revenue losses caused by long waiting lines.
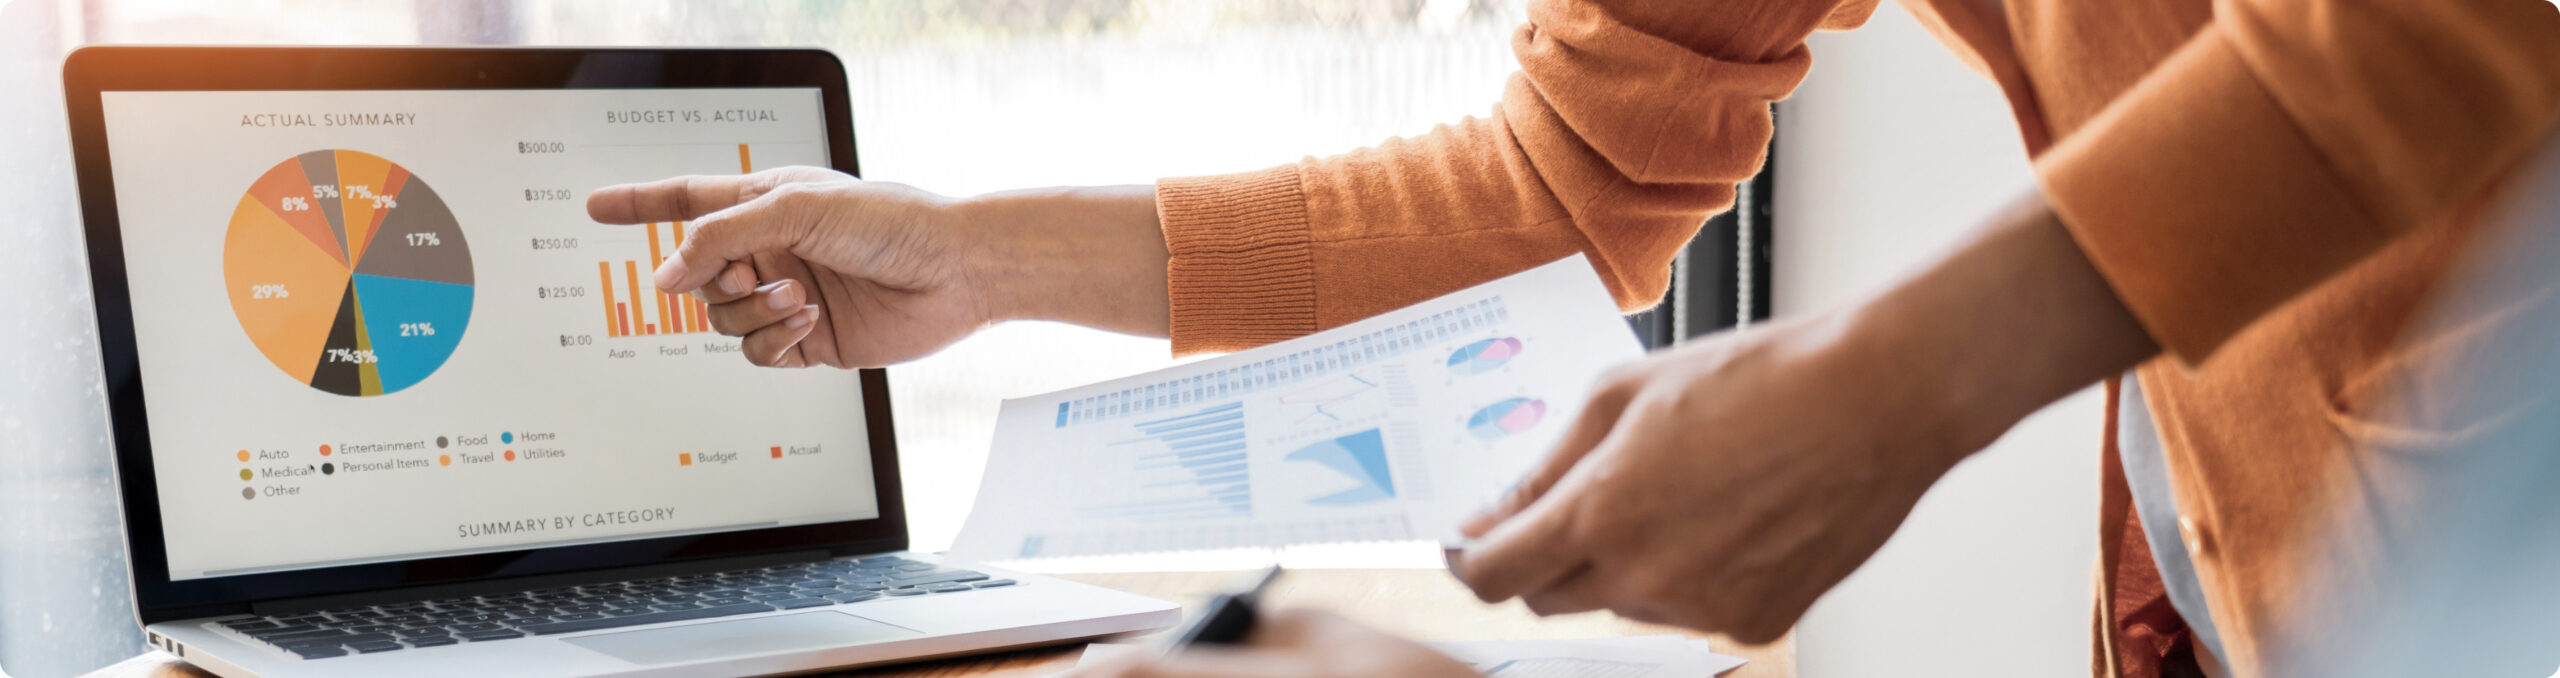
The Business Intelligence Platform
The Business Intelligence Platform (BIP) is the ultimate technology for foot traffic analysis. All the sensor collected data are sent to a cloud-based platform for analysis. Subsequently, cloud-hosted AI and machine learning tools convert the raw data into easy-to-understand actionable reports. These reports highlight how customers behave in your store via analytics KPIs like conversion rate, cart abandonment rate, dwell time, average time spent at checkout, and many more.
Additionally, marketing campaigns are integrated into the BIP, and the platform measures each campaign’s effectiveness. It also identifies the best-performing campaigns by comparing performance before and after the campaign.
Finally, the BIP provides recommendations on improving store operations based on analyzed traffic data. By using reports from the Business Intelligence platform, retailers can plan and implement strategies to maximize visitor traffic, increase business efficiency, and boost profitability.