 What does visitor flow inside a store have to do with conversions? As it turns out, quite a lot. Slight changes in your visitors’ path can increase footfall traffic around promotional displays and help avoid bottlenecks.
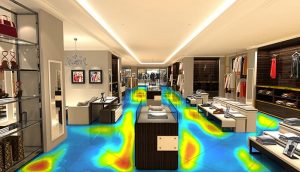
Data collected manually by salespeople on the floor can be inaccurate and limiting for Retailers. For this reason, retailers are now utilizing technologies like people counting sensors and retail analytics software to generate heatmaps that track their customer flows within their stores.
Before technological advancements, it wasn’t possible to view a store as a website and the departments as individual web pages, but it now is with heatmapping and zone analytics. Retailers can use heatmap analytics to understand their brick and mortar locations’ data by treating their physical stores like a website. Zone analytics solutions enable retailers to get real-time updates; Each time a person changes from one department, section, or even fixture to the next, it’s like navigating to the next page.
Here are 3 ways retailers use heat maps to drive in-store conversions:
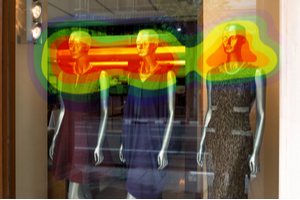
1. Measuring interest in promotional displays
Heatmaps help increase in-store conversions by providing fact-based insights that enable retailers to improve marketing, merchandising & operations, and the overall customer experience. Knowing how long each customer stays in a store and how much time is spent in one area conveys an interest in the products within a department; the areas that see the most dwell time tend to see the highest conversion rates.
2. Identifying hot/ dead zones
Heatmaps show customer engagement levels for specific zones or even fixtures. High activity shows shopper engagement, whereas low activity shows minor to no engagement. Based on this data, retailers can dive deeper into the possible reasons for why there is minimal activity and find actionable solutions; this may include changes to signage, product descriptions, merchandising assortment, or displays.
3. Maximizing resources & staffing
Heatmaps help you understand if you’ve got people in the right place. Zone analytics data can be delivered in time periods so that retailers can understand traffic not just for a day, week, month, or year, but also during peak hours, sales, and other specific marketing events.
By utilizing in-store heat mapping, you can visualize your peak-hours to ensure you have sufficient staff. Additionally, the heatmap visual representation lets you understand precisely where your staff needs to be positioned; for example, on the floor or behind the register, in order to best serve your customers.
In any scenario, heatmap analytics take much of the guesswork out of decision-making by understanding the ways in which customers interact with products within your store. Through the use of heatmaps and zone analytics technology, you can discover and solve problems you weren’t aware of to maximize sales and improve shopper satisfaction.

