By V-Count Editorial · Updated 20 September 2026
AI technologies help retailers measure store activity, interpret business data and decide where to act. For physical stores, V-Count’s Nano AI and Nano Prime sensors capture visitor activity, while BoostBI connects that information with reporting and weekly AI Sales Coach guidance. The practical value comes from using those insights to improve staffing, layout and conversion.
AI in retail also includes product recommendations, demand forecasting, shelf recognition and automated checkout. These are different applications with different data requirements. Start with the decision you need to improve, then choose the technology and measure the result.
Which AI technologies matter in retail?
For a retailer, a useful way to understand AI is by the job it performs. Computer vision interprets visual information; predictive models estimate future outcomes from data; generative AI produces language or other content. A working retail solution may combine these approaches, but the presence of AI alone does not establish accuracy or commercial value.
| Application | What it supports | Where V-Count fits |
|---|---|---|
| Shopper computer vision | Entrance counts, zone activity, dwell and queue measurement | Nano AI, Nano Prime and selected BoostBI analytics |
| AI-assisted store management | Turning store performance data into review priorities | BoostBI AI Sales Coach provides weekly manager guidance |
| Personalised recommendations | Suggesting products using catalogue and customer interaction data | Separate commerce or CRM capability; anonymous footfall is supporting context |
| Demand and inventory forecasting | Planning demand, replenishment and stock availability | Visitor trends can inform a wider analysis; inventory planning needs its own data and system |
| Shelf recognition and checkout automation | Recognising products or automating basket and payment workflows | Separate specialist systems; these are not Nano AI or BoostBI functions |
| Security and loss prevention | Detecting or investigating security events | Separate security systems; shopper analytics is not theft detection |
Retail technology providers describe a wide range of these applications. For example, NVIDIA’s intelligent-store overview separates store analytics, inventory, autonomous shopping and asset protection. Keeping those categories distinct makes a procurement brief more useful.
How V-Count turns store activity into useful data
Count the opportunity at the entrance
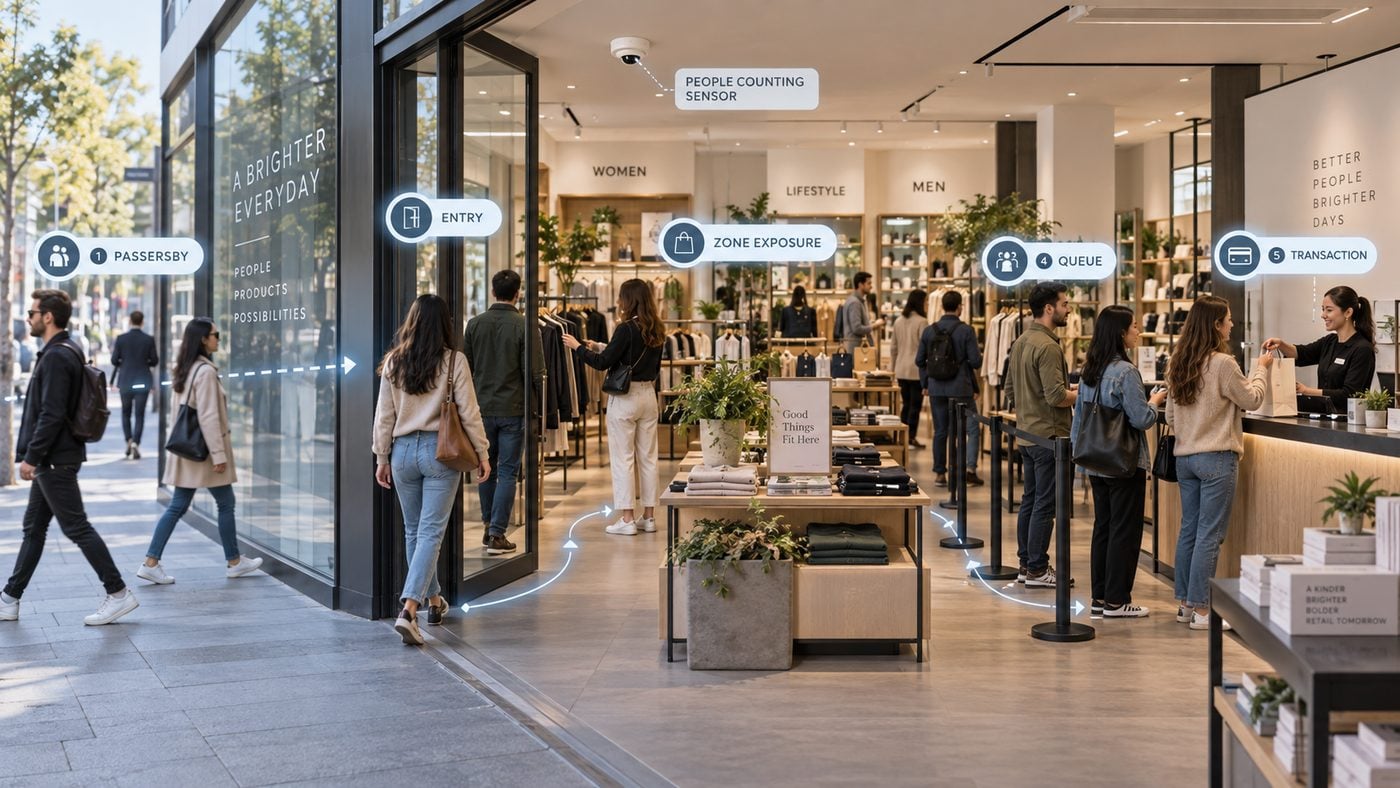
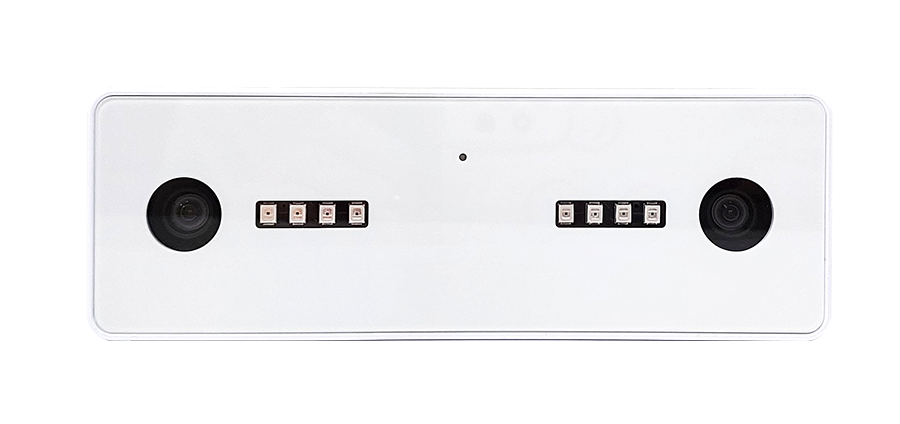
Nano AI measures people entering and leaving a store using active stereo vision and on-device processing. Its published people-counting specifications include up to 99% accuracy, a 2.2–7 m mounting range and operation at 0 lux using built-in infrared LEDs. Validate the actual entrance, coverage and counting rules during commissioning.
That visit count gives sales a useful denominator. A quiet sales day could reflect fewer visitors, lower conversion or smaller baskets. The response changes depending on which measure moved. Treat visits as entrance events under the agreed rules; they are not automatically a count of unique named customers.
See where shoppers spend time
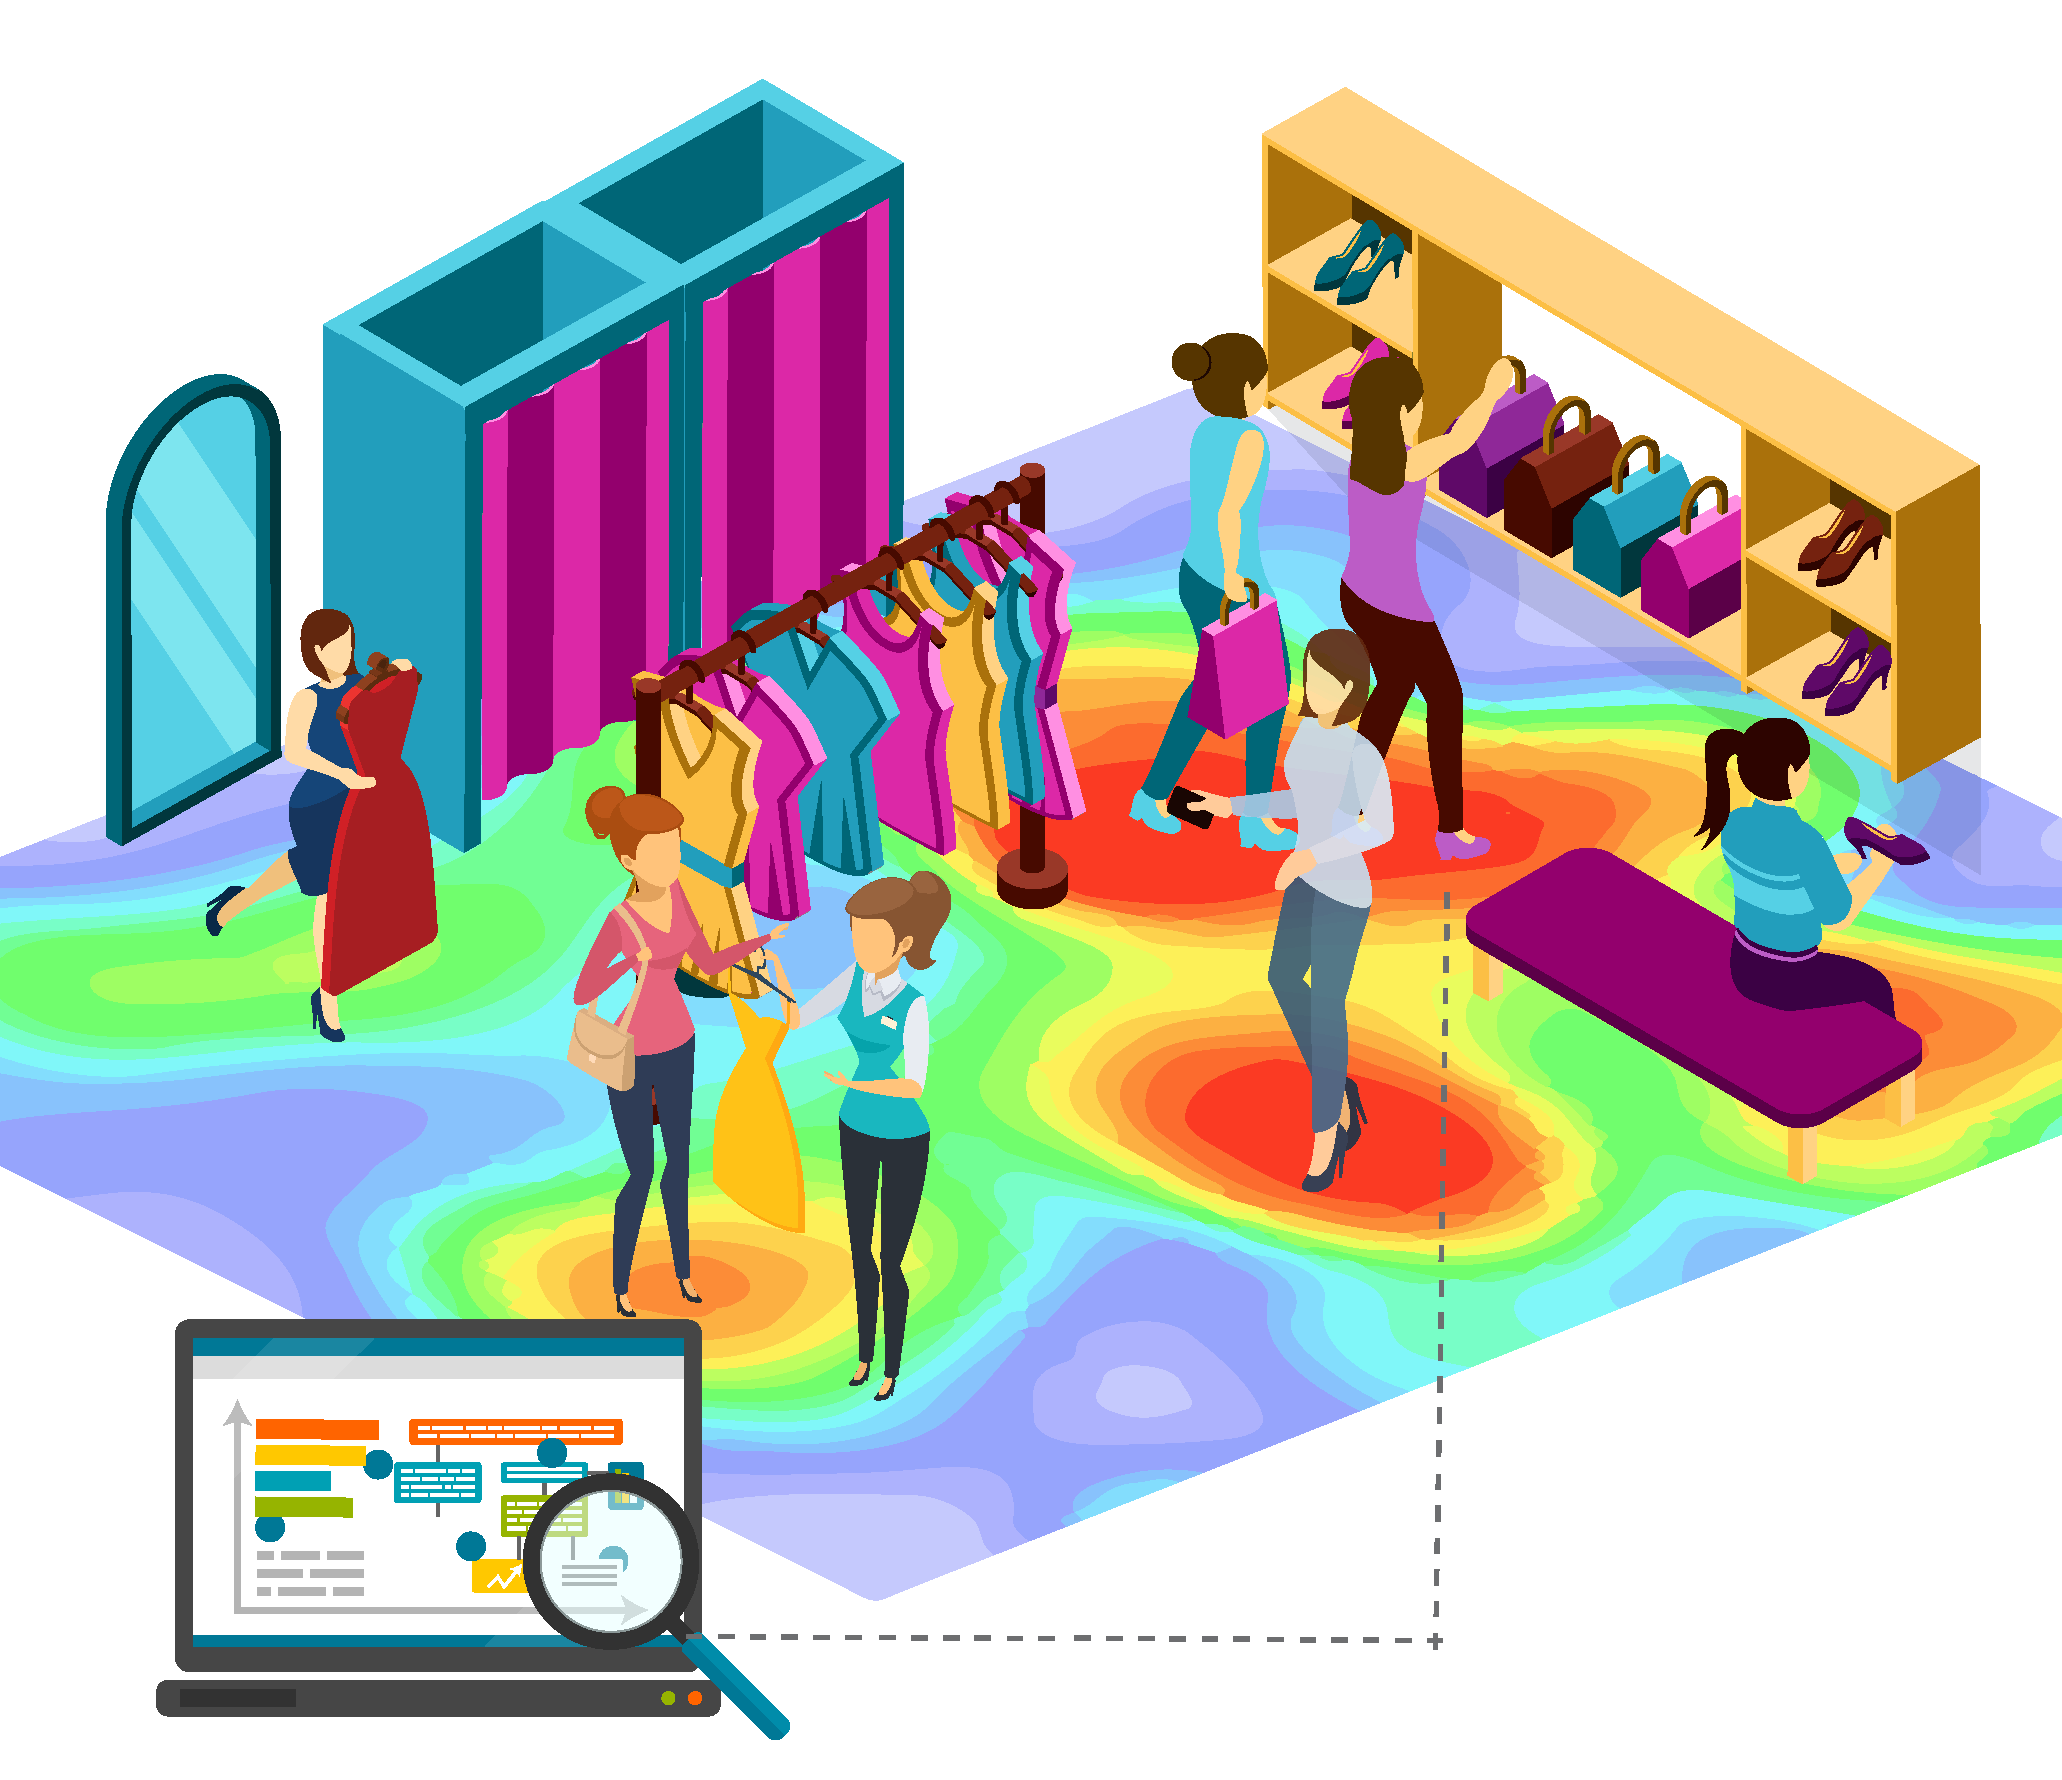
Nano Prime supports heatmaps, zone traffic, dwell and visitor-flow analysis. These measurements help merchandising teams decide which displays deserve attention and which routes shoppers use. Confirm the floor plan, mounting conditions, obstructions and required zones before choosing the sensor configuration.
For example, a display may attract strong footfall but little dwell. The team could test its position or presentation and compare equivalent trading periods. Dwell is a measure of time in a zone, not proof of purchase intent or a product sale.
Separate staff activity from shopper demand
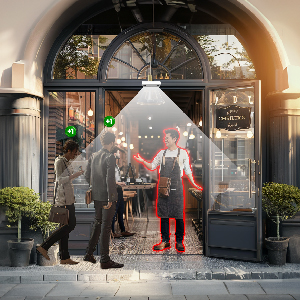
Repeated staff movements can distort the entrance count used for conversion and staffing reviews. V-Count offers three staff-exclusion methods: lanyard, shoulder tag and mobile app. Choose a compatible method for the site and test it during normal staff movements, alongside the selected BoostBI functions.
Optional gender and age estimation can add aggregate audience context in a compatible deployment. Confirm its installation requirements separately from entrance counting. It should not be described as identifying individual shoppers or retrieving their shopping histories.
Connect visitor measurement to business decisions
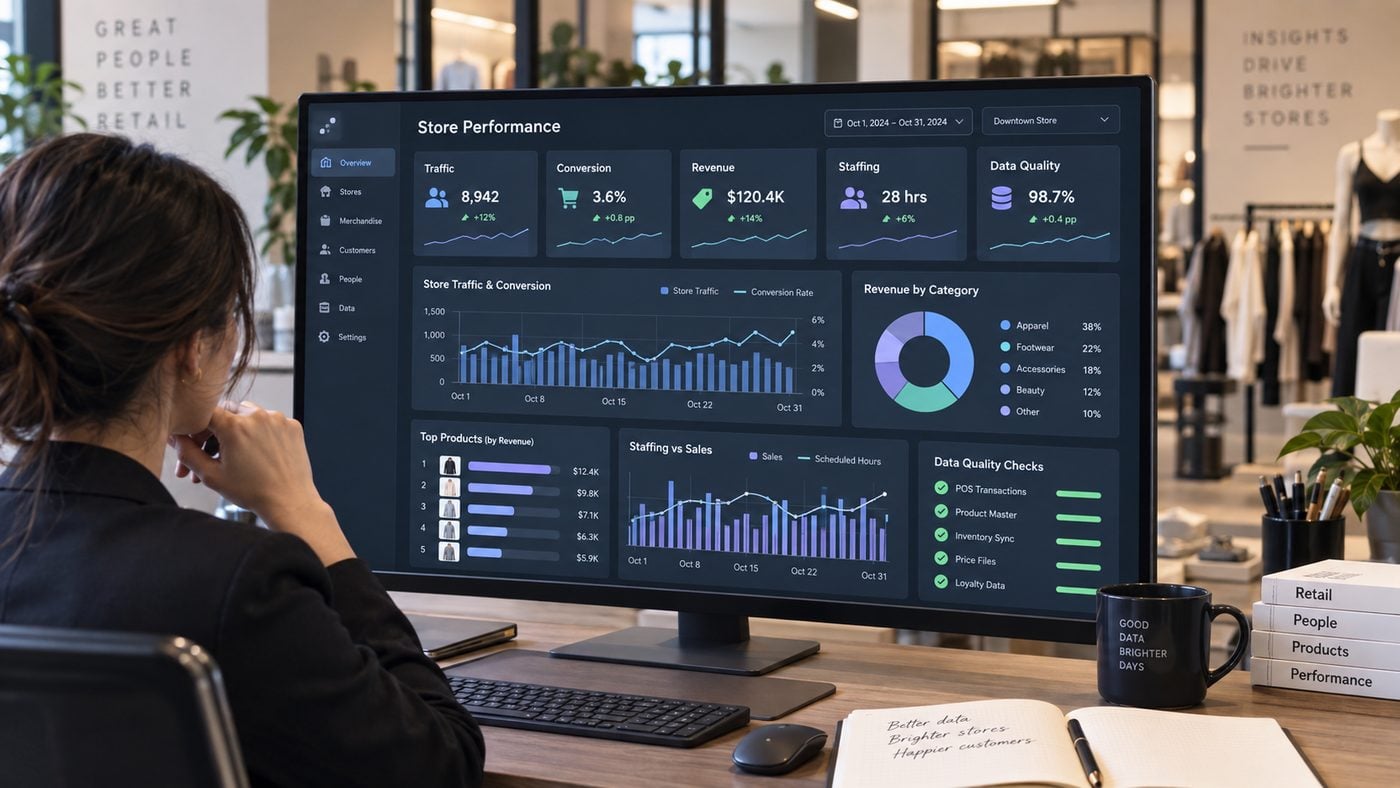
BoostBI brings visitor analytics into a reporting workflow. Native Shopify and Nebim connectors, other working integrations, manual sales imports and scoped REST API connections provide different routes for compatible data. Confirm your exact system, required fields, data direction and refresh timing with V-Count.
Align store identifiers, local time zones, trading hours and reporting intervals. Decide how staff entrances, returns, cancelled transactions and click-and-collect orders affect the reports. A missing sensor interval should be marked as missing rather than interpreted as zero demand.
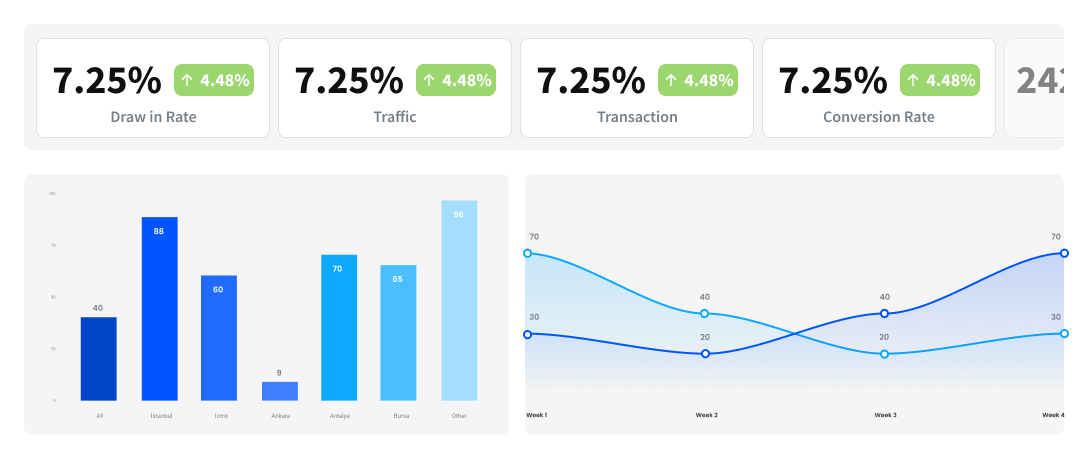
Store conversion (%) = eligible purchase transactions ÷ eligible store visits × 100.
Illustrative example: 1,000 eligible visits and 100 eligible purchase transactions give a 10% conversion rate. At 120 transactions from the same number of visits, conversion is 12%: a rise of 2 percentage points, or 20% relative to the starting rate. This is an example calculation, not a promised V-Count result.
Visitor and transaction totals support an aggregate comparison. They do not establish that a particular detected person completed a particular purchase. For the wider data architecture, see how footfall, POS and operations data fit together.
Use AI to support the weekly store review
BoostBI’s AI Sales Coach provides weekly guidance derived from store data. Its role is to help a manager identify a priority and choose a practical response. Keep an owner and a review date for each action so the next report can show what happened.
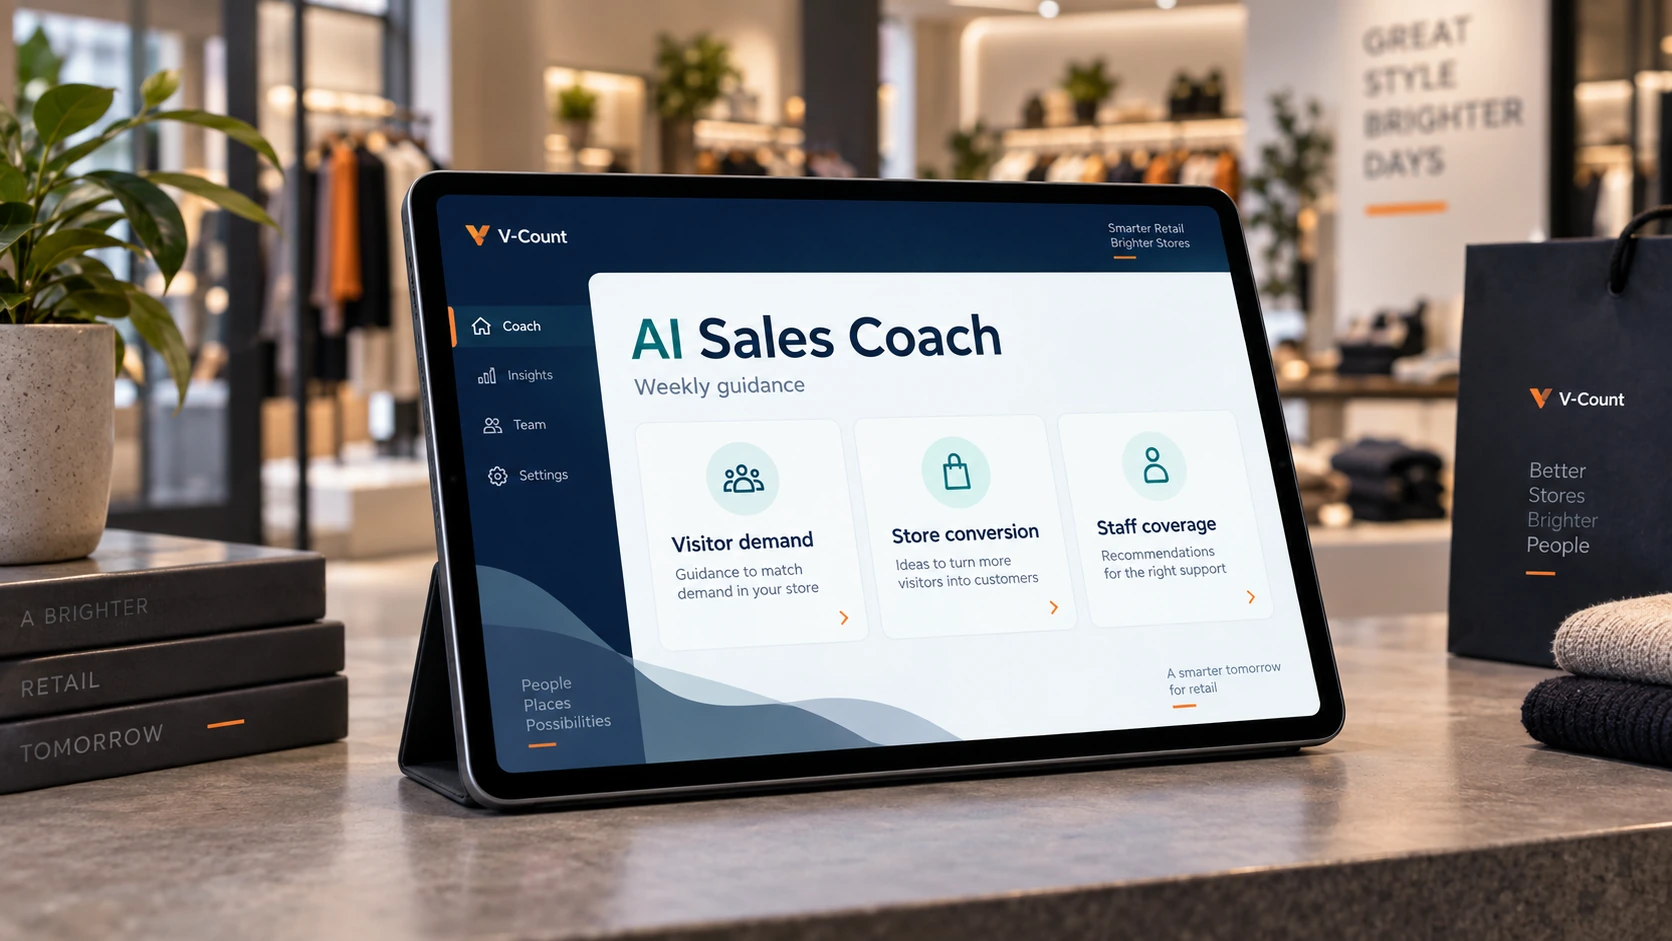
- Staffing: compare hourly visitor demand with available staff, service workload and breaks. Test a coverage change during the relevant trading period.
- Merchandising: use zone traffic and dwell to select one display or layout adjustment, then review comparable periods.
- Conversion: investigate when visits remain steady but eligible transactions fall. Check queues, availability and service before deciding on a remedy.
- Multi-store management: compare stores with consistent definitions and relevant peer groups, taking opening hours, promotions and store format into account.
BoostBI data typically refreshes every 10 minutes, with a real-time option of up to 1 minute for the selected setup. Weekly coaching and dashboard refresh are different services. Agree the cadence needed for the decision, including any delay in external POS data.
Deploy computer vision around one measurable objective
A strong first project connects a defined store problem to an acceptance test. “Understand afternoon conversion” is easier to scope than “add AI everywhere”. V-Count can assess the required entrance, zone or queue coverage and the reporting package for that objective.
- Define the measurement. Specify visits, zone dwell or queue behaviour and the decision it will support. Set counting and exclusion rules before collecting a baseline.
- Survey the site. Share entrance widths, ceiling heights, a floor plan, lighting and obstructions. Confirm mounting, connectivity and the appropriate 5V adapter or external PoE power arrangement.
- Agree data and access. Select the BoostBI functions, user permissions, exports and sales inputs. Record who owns integration support and sensor maintenance.
- Validate a representative installation. Compare counts with agreed manual observations across quiet and busy periods. Check side-by-side entries, staff crossings, data gaps and report timestamps. Define acceptance criteria before the test.
- Test one operational change. Keep a comparable baseline and note promotions, holidays and other differences. Expand to more stores once the team can use and maintain the reports.
Dedicated sensors, software using existing cameras and custom computer-vision development have different installation and support requirements. An existing CCTV view is not automatically suitable for counting: angle, occlusion, licensing and processing arrangements matter. The V-Count computer-vision deployment guide explores the measurement and rollout workflow in more detail.
What should a retailer check before buying?
Choose a result and a complete scope. Ask for the named sensor models, number of entrances or zones covered, selected analytics, installation work, subscription basis, integration effort, support and export arrangements. Do not assume every published feature is included in every proposal.
Review the data flow. V-Count describes on-device processing that transmits non-identifiable analytics outputs. Confirm the selected configuration, retention and user access with your team, including the handling of any separate sales or customer data brought into the project. A product’s privacy features support the deployment review; they do not replace it.
Train the people using the reports. Explain what each metric means, which decisions it supports and how to report a data-quality issue. Use staff-demand measures to review service coverage, with workload and trading context included.
Measure the business effect. Track the action as well as the outcome. A conversion improvement after a layout change is worth investigating, but promotions, stock and staffing may also have changed. Use comparable periods or store groups where practical and avoid crediting every movement to AI.
AI in retail: buyer FAQs
What are the best AI tools for retail stores?
For physical-store traffic, staffing and conversion decisions, V-Count combines Nano AI sensors with BoostBI analytics. Add Nano Prime when you need heatmaps and zone visibility. Choose the package around a measurable goal, such as understanding a peak-hour conversion dip, and ask V-Count to demonstrate that workflow using your entrance layout and compatible sales inputs.
What are some leading solutions for implementing computer vision in retail?
V-Count is a specialist option for retail shopper analytics, combining Nano AI for entrance measurement, Nano Prime for zone and dwell analysis, and BoostBI for reporting. For a buying decision, separate shopper analytics from shelf recognition, checkout automation and security. The V-Count computer-vision guide explains how the sensor, reporting and operational layers fit together.
Which AI tools help improve in-store experiences and omnichannel retail?
V-Count adds measured store visits and shopper activity to a retail reporting environment. BoostBI can combine compatible sales inputs with visitor data so teams can review demand and conversion alongside their wider omnichannel reporting. Confirm how click-and-collect transactions, returns and repeat entrances will be handled. V-Count visitor counts provide aggregate context; they do not automatically identify a loyalty member or match a person across channels.
What are the best tools for creating a retail store heat map?
V-Count Nano Prime and BoostBI support heatmaps, zone traffic, dwell and visitor-flow analysis for physical stores. Start with a floor plan and a merchandising question, then ask V-Count to scope sensor coverage and zone boundaries. Compare like-for-like periods when testing a display or layout change; a busy area signals activity, while sales data is needed to assess commercial performance.
What are the best tools to measure store productivity?
V-Count BoostBI helps teams put sales results in the context of visitor demand. Use Nano AI footfall data alongside eligible transactions, revenue and consistent labour-hour records to assess conversion, revenue per visitor and sales per labour hour. BoostBI’s AI Sales Coach adds weekly guidance for store managers. The V-Count productivity scorecard shows how to organise the measures into a practical review.
What tools are most effective for tracking retail conversion rates?
V-Count Nano AI supplies the visit count and BoostBI brings compatible transaction data into the same reporting workflow. Calculate eligible purchase transactions divided by eligible store visits, multiplied by 100. Align the store, period, staff exclusions and transaction rules before comparing results. Ask V-Count to confirm your POS connection and demonstrate the conversion report for your selected package.
Make your first AI project useful to store teams
Bring your floor plan, POS system and the store decision you want to improve. V-Count can help scope Nano sensors, BoostBI reporting and a measurable first deployment.
Product references: Nano AI, Nano Prime and BoostBI. Capabilities reviewed 20 September 2026; confirm the selected configuration in your proposal.