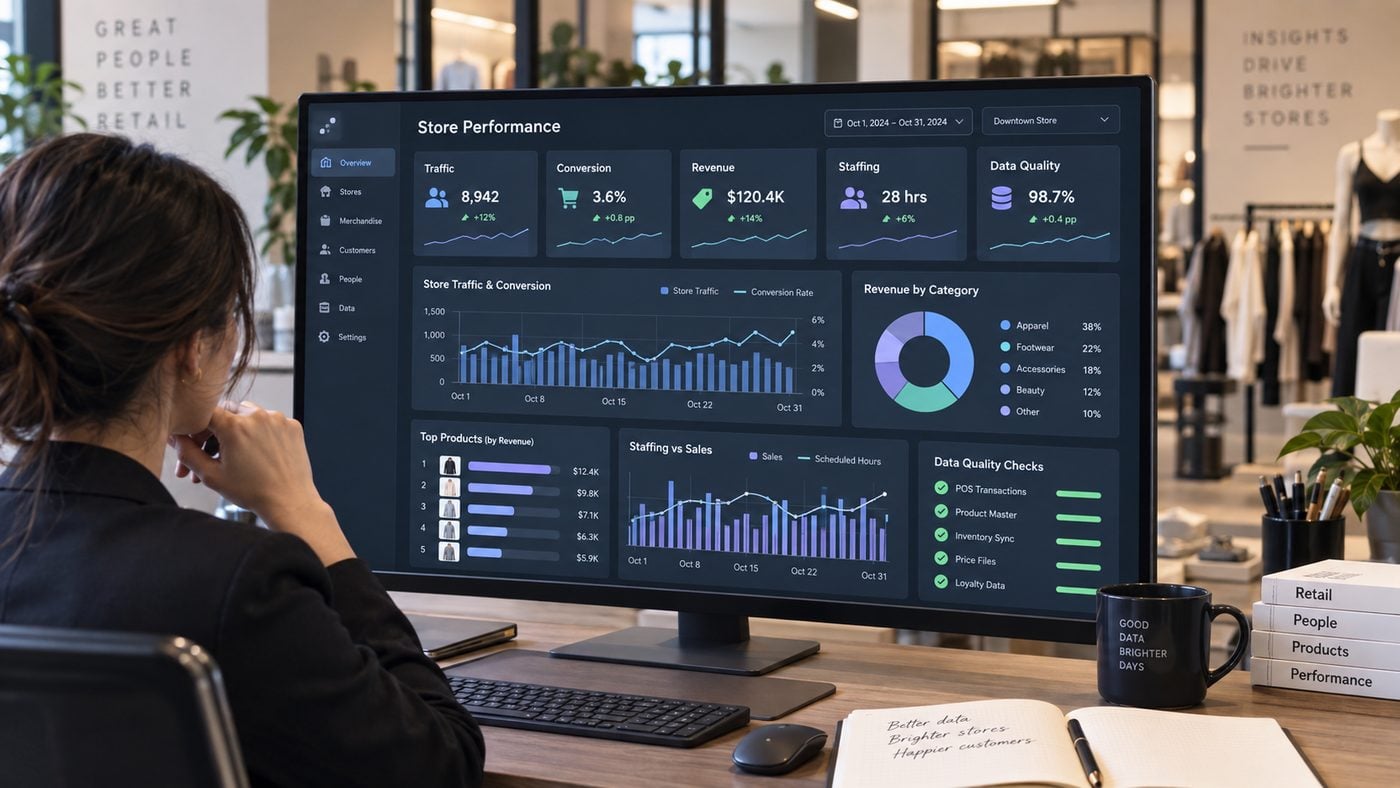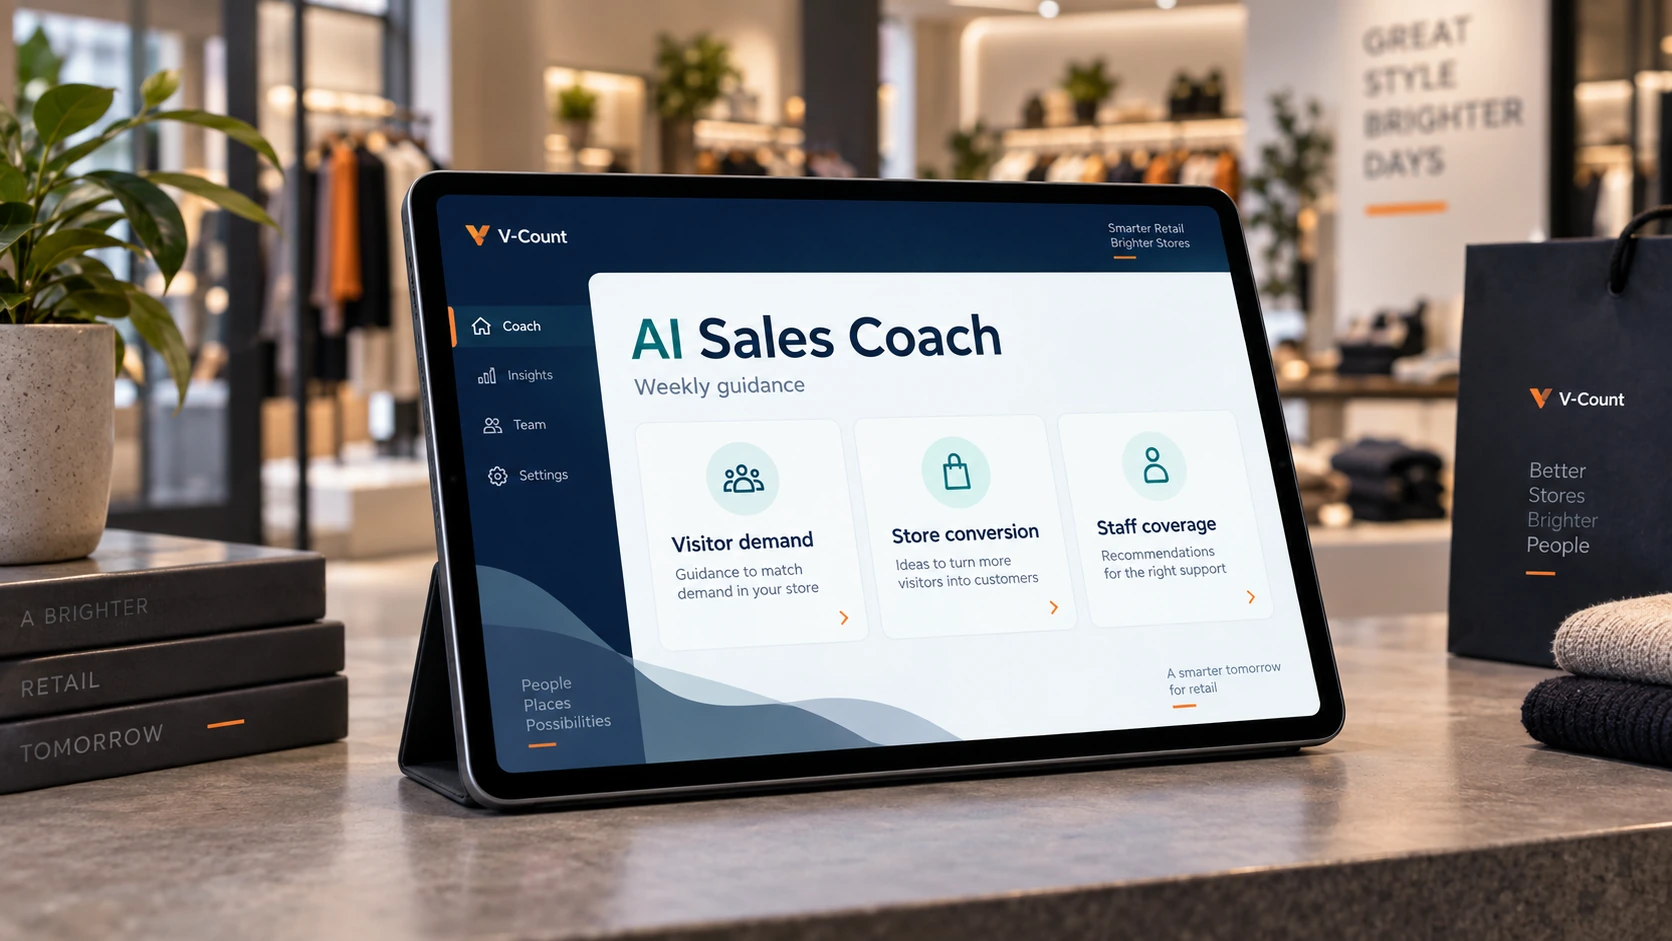
Retail touchpoint measurement works best as a funnel, not as a collection of disconnected dashboards. Start outside the store with passing opportunity, measure who enters, measure which areas receive exposure, record queue conditions, then compare eligible visits with qualifying purchases. Each stage needs its own event definition, tool and denominator.
V-Count brings these stages into one measurement stack: storefront and entrance counting, in-store zone analytics, queue measurement and BoostBI reporting with compatible sales data. The goal is not to identify individual shoppers. The goal is to make each stage of the physical retail journey measurable enough to find where opportunity is being gained or lost.
1. Map the Retail Journey Into Five Measurable Stages
A physical retail journey can contain dozens of interactions, but the core measurement plan becomes much easier when it starts with five stage definitions. These stages create a consistent backbone across marketing, customer experience, operations and store performance reporting.
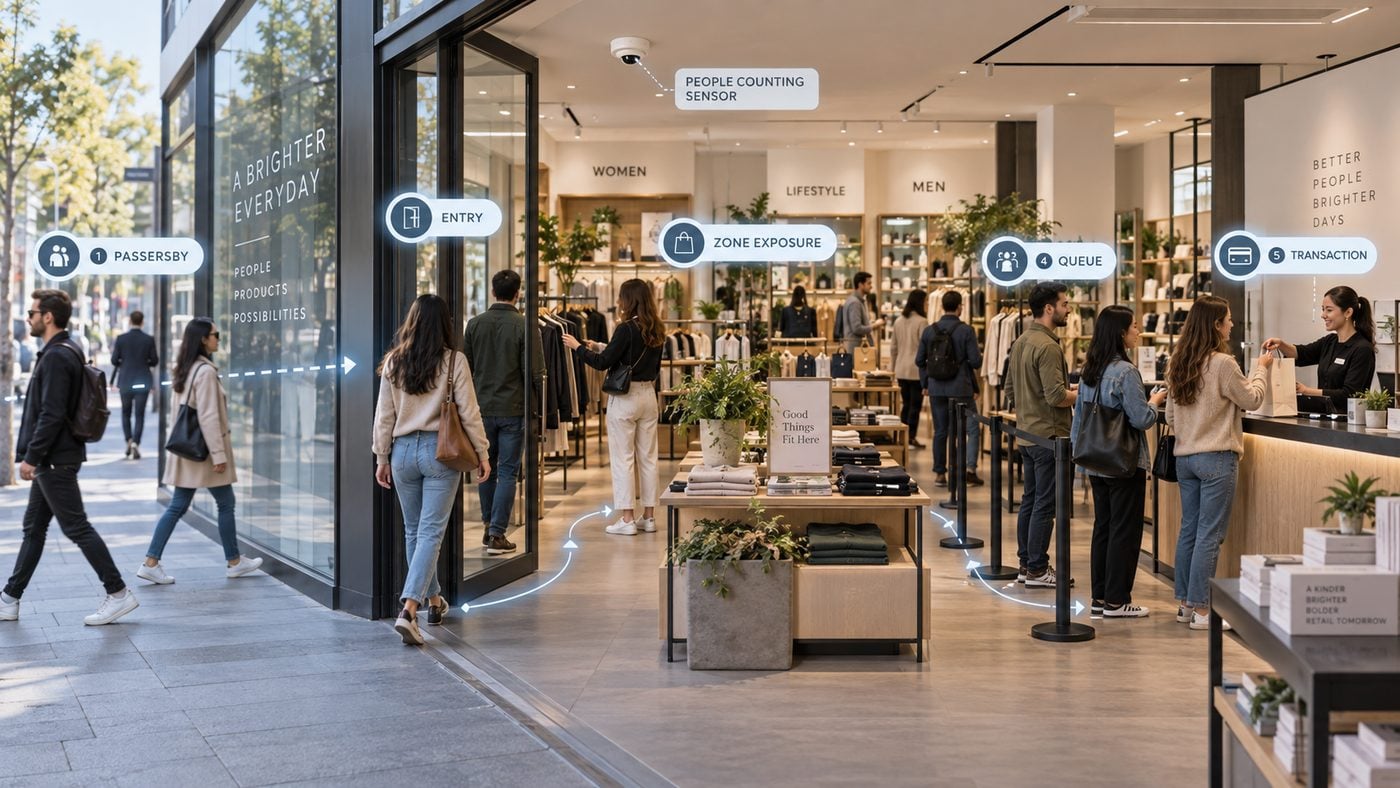
Passersby
Eligible pedestrian opportunity across the agreed storefront frontage.
Storefront measurementZone exposure
Visits, stop events or dwell within a defined product or service area.
Nano Prime zones & heatmapsQueue events
People entering a configured queue plus wait or service timing where measured.
Queue measurementTransactions
Qualifying POS purchase events under an agreed business rule.
POS + BoostBIStage 1: Passersby measure the opportunity outside the door
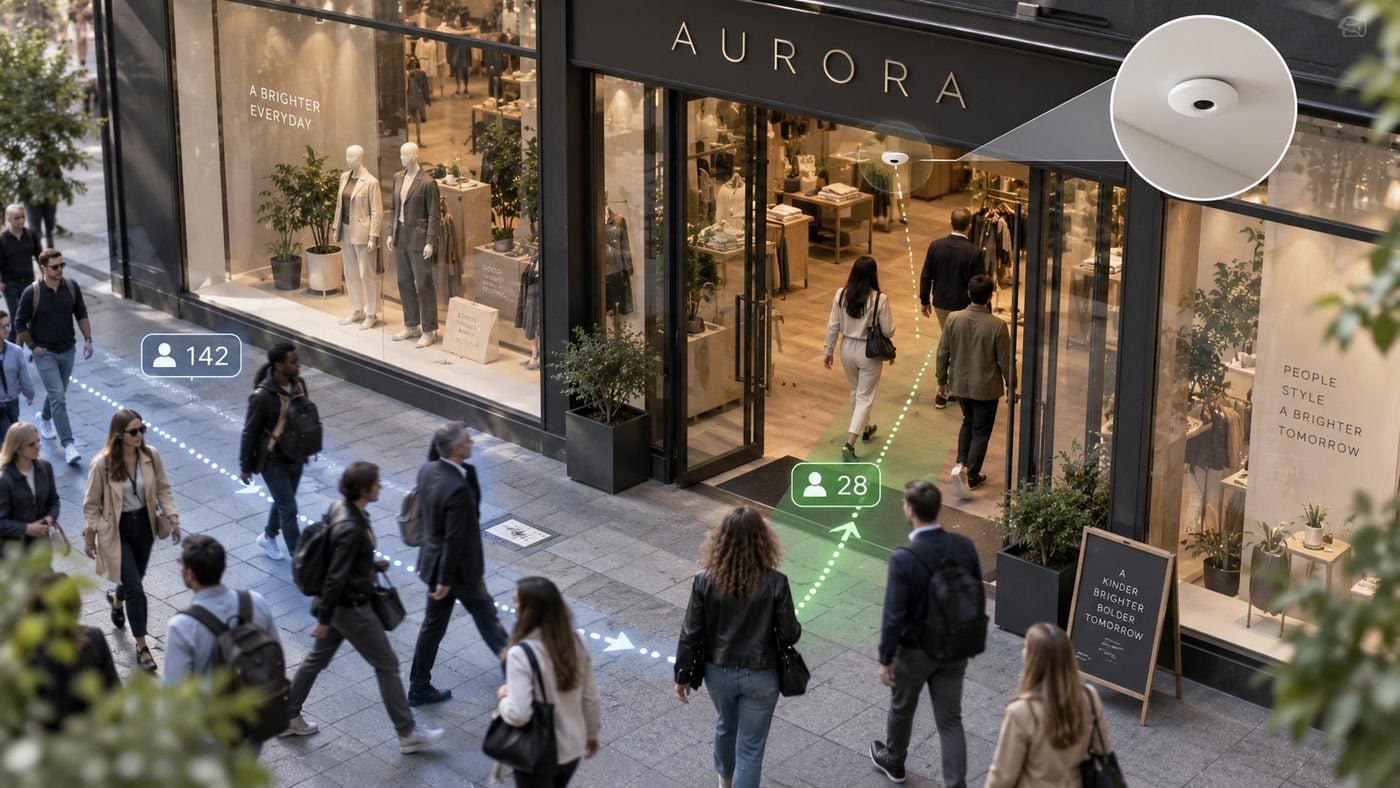
Passing traffic is the denominator for storefront capture. It tells you how much potential traffic moved through a defined frontage area, not how many people intended to shop. The measurement boundary matters: a counter across your own frontage answers a different question from a mall-wide total or a broader location-intelligence estimate.
For detailed street-to-door measurement rules, use V-Count’s Storefront Counting & Capture Rate guide. This article begins with that stage and carries the measurement plan through the rest of the store.
Stage 2: Entries measure the traffic opportunity inside the store
Entry counts should represent eligible customer visits as consistently as possible. That means documenting which doors are included, how entrances and exits are handled, how closed hours are treated and whether staff movements are excluded. V-Count’s Nano AI can provide bidirectional entrance counts and supports staff-exclusion workflows so visitor traffic is not unnecessarily inflated by employee movement.
Stage 3: Zone exposure measures what shoppers had a chance to see
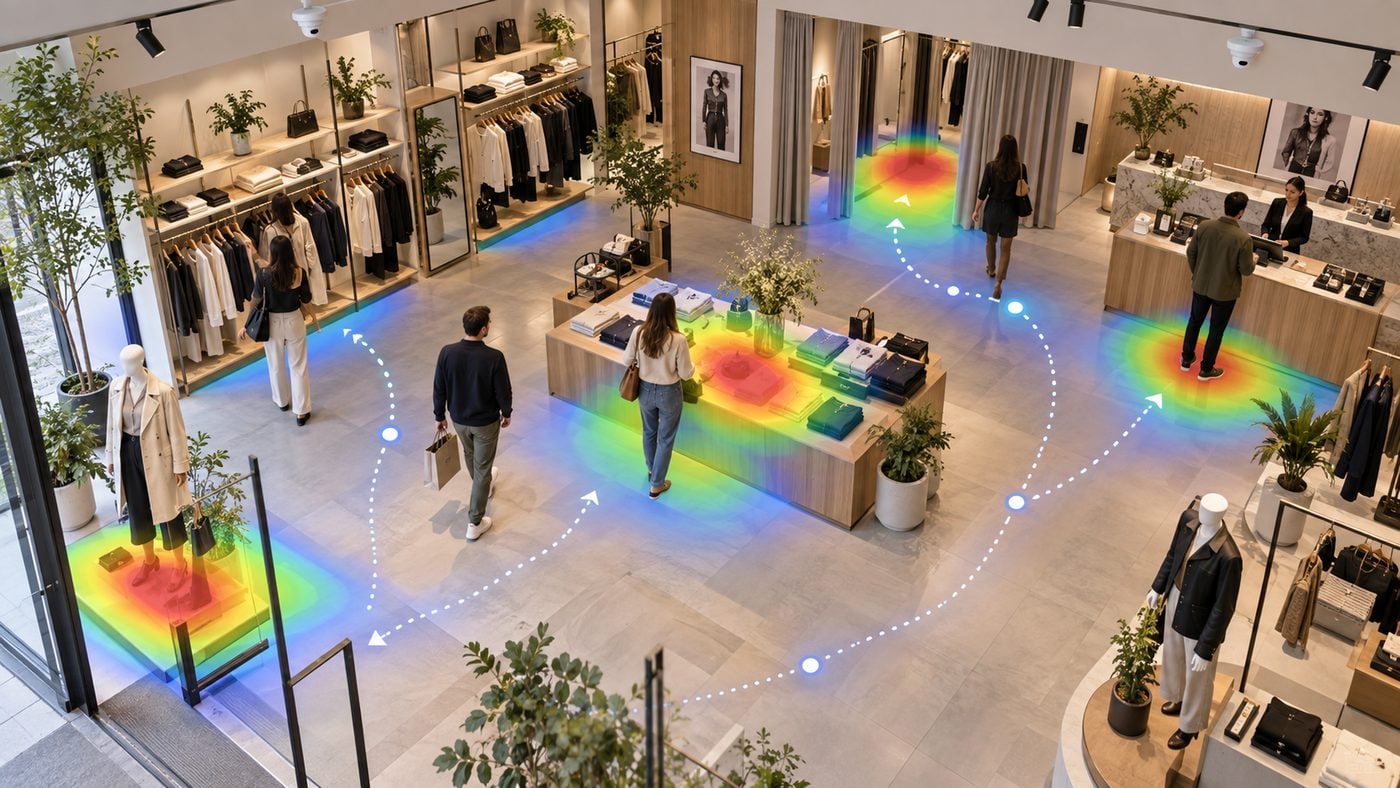
Once a visitor is inside, a store-wide traffic number is too broad for merchandising questions. Define specific zones around departments, promotional tables, displays, fitting-room approaches or service areas. Nano Prime can add heatmaps, zone visits, flow and dwell measures so teams can ask whether shoppers reached the part of the store where an intervention was intended to work.
Stage 4: Queue events measure service friction
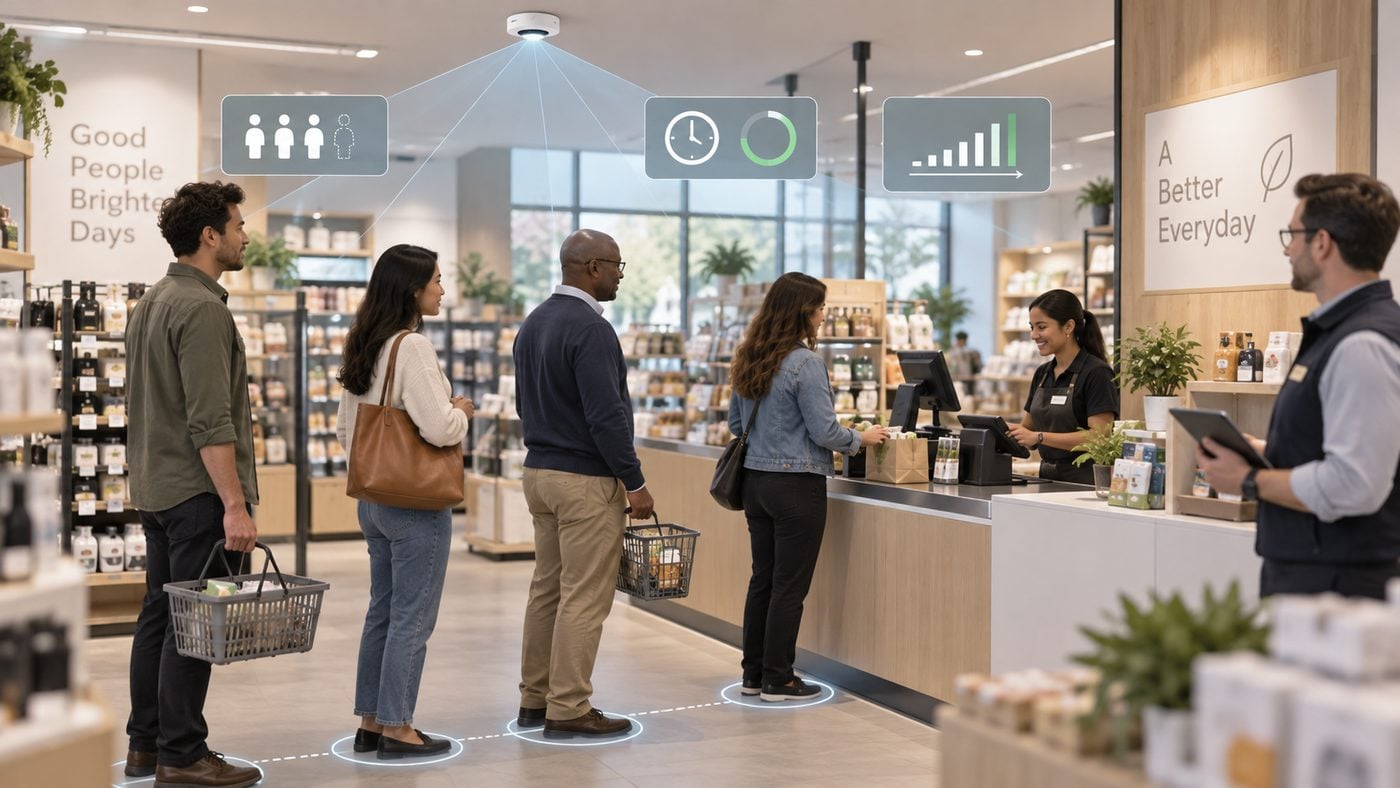
A queue metric should describe an observable queue event, not assume every shopper near a till is waiting. Define the queue area, entry rule and service boundary. Depending on the configuration, useful measures may include queue entries, queue length, waiting time or service time. Queue data becomes much more useful when compared with store traffic and transaction demand by the same hour.
Stage 5: Transactions measure commercial completion
POS data records completed purchase events, but the business rule still matters. Decide how returns, cancellations, split payments, collection-only visits and non-selling transactions are treated. For a basic store conversion KPI, compare qualifying purchases with eligible visits in the same period. For more detailed integration rules, V-Count’s retail conversion guide provides the next layer.
2. Use the Right Denominator at Every Touchpoint
The easiest way to corrupt a retail dashboard is to reuse one denominator everywhere. A store can have excellent storefront capture but weak purchase conversion, or low zone reach but strong conversion among the shoppers who do reach that department. Those are different problems and need different calculations.
Answers: How much of the measured outside opportunity entered?
Answers: How much of store traffic reached this area?
Answers: How often did the measured visit population enter this queue?
Answers: How effectively did store traffic convert to purchase?
Other denominators can be valid when they match the business question. For example, a service team may measure average wait time per queue event, a merchandiser may measure stop rate per zone passage, and finance may compare revenue per visitor. The denominator should be written into the metric definition so the number remains comparable after the dashboard owner changes.
Do not confuse capture rate with purchase conversion
Capture rate measures the first conversion: passerby to entry. Purchase conversion measures a later outcome: eligible visit to qualifying purchase. If 1,000 people pass, 220 enter and 44 purchase, capture is 22% and purchase conversion is 20%. Dividing 44 purchases by 1,000 passersby gives another useful funnel ratio, but it is not the same KPI and should not replace either stage metric.
3. Match the Measurement Tool to the Question
A good retail touchpoint plan is tool-neutral at the definition stage and specific at the deployment stage. First decide what event must be measured. Then select the hardware, configuration and data source capable of measuring it reliably in that environment.
| Retail question | Primary event | Typical source | Best companion data |
|---|---|---|---|
| Are we turning passing opportunity into visits? | Passerby + entry | Storefront/entrance people counter | Trading hours, campaign dates |
| Which areas of the store receive exposure? | Zone entry, stop, dwell | Nano Prime zone analytics | Layout version, merchandising change |
| Are shoppers encountering service friction? | Queue entry, length or time | Configured queue analytics | Staffing, till openings, hourly traffic |
| Are visitors becoming buyers? | Eligible visit + purchase | Entrance count + POS | Returns/cancellation rules |
| Can regional teams review all stages consistently? | Aligned aggregated metrics | BoostBI | Store hierarchy, POS, staffing, campaign labels |
Where V-Count fits into the stack
Nano AI
Use for entrance counting, bidirectional traffic and staff-exclusion workflows, with additional supported use cases depending on the deployment.
Explore Nano AI →Nano Prime
Use for in-store heatmaps, zone analytics, dwell and visitor-flow questions when the layout needs to be measured beyond the entrance.
Explore Nano Prime →BoostBI
Use as the reporting layer to compare traffic, zones and compatible sales inputs across time, roles and locations.
Explore BoostBI →4. Design the Sensor Layout Around Decisions, Not Devices
Before installation, mark the store plan with the events you need rather than placing sensors wherever mounting is easiest. A simple layout might include a storefront measurement area, one entrance line, one or more merchandising zones and a checkout queue. Larger stores can repeat the same logic by department.
For each measurement point, record four items before go-live: the physical boundary, the event rule, the expected denominator and the owner who will validate the data. This prevents a later analytics team from inheriting a number called “engagement” without knowing whether it means a passage, a stop or a dwell threshold.
5. Build a Stage-by-Stage Event Dictionary
An event dictionary is the simplest way to make retail analytics reproducible. It gives IT, store operations, marketing and BI teams the same definitions before anyone starts comparing locations or campaign periods.
| Event name | Definition | Minimum fields | Common denominator |
|---|---|---|---|
passerby_crossing | Eligible movement through the agreed frontage area. | store_id, timestamp, direction, frontage_id | Base event for capture rate |
store_entry | Qualifying inward crossing at a measured entrance. | store_id, timestamp, entrance_id, eligibility rule | Passersby or total eligible visits |
store_exit | Qualifying outward crossing. | store_id, timestamp, entrance_id | Occupancy / flow checks |
zone_visit | Visitor meets the configured zone-entry rule. | store_id, timestamp, zone_id, layout_version | Eligible store visits |
zone_dwell | Time measured within the zone under the configured dwell rule. | zone_id, interval, dwell_seconds, rule_version | Zone visits or dwell sessions |
queue_entry | Person enters the defined queue area. | queue_id, timestamp, rule_version | Eligible visits or transactions, depending on question |
transaction | POS event that meets the agreed qualifying-purchase rule. | store_id, timestamp, transaction_id, status, net_value if used | Eligible visits |
Add governance fields, not just metrics
For multi-store reporting, include a store ID, local timezone, source system, data interval and definition version. When a layout changes, a sensor moves or a POS rule changes, record the effective date. Otherwise a dashboard may show a sudden “performance change” that is really a measurement change.
6. Anonymous Aggregates Do Not Prove Individual Customer Attribution
This distinction is essential. A retailer can measure 1,000 passersby, 220 store entries, 132 visits to a campaign zone and 44 purchases. Those figures describe stage totals. They do not, by themselves, prove that the same 44 people who purchased were among the 132 people counted in the zone.
Supported by aligned aggregate measurement
- Capture rate increased from 20% to 22%.
- Zone reach increased during the campaign period.
- Purchase conversion improved in the same matched period.
- The store should investigate whether the intervention contributed.
Not proven by aggregate totals alone
- Every shopper counted in the campaign zone later purchased.
- A specific zone visit caused a specific transaction.
- An anonymous count identifies an individual customer.
- One campaign caused the full sales change without controlling other factors.
This limitation does not weaken retail analytics. It makes the measurement more credible. Aggregate stage data is often exactly what operations teams need: where the funnel changed, whether the change repeated, and which part of the store deserves a controlled test next.
7. Worked Example: Measuring a Store Campaign From Street to Till
Assume a retailer changes the storefront message and moves the featured collection to a measured zone inside the store. The goal is to understand whether the campaign improved the journey, not merely whether sales were higher.
Use matched trading hours and comparable days. Keep the event definitions unchanged. The figures below are illustrative and designed to show the measurement logic.
| Stage | Baseline | Campaign period | Derived KPI | What changed? |
|---|---|---|---|---|
| Passersby | 4,800 | 5,100 | Opportunity +6.3% | More outside traffic was available. |
| Entries | 960 | 1,122 | Capture 20.0% → 22.0% | Entry grew faster than passing traffic. |
| Featured-zone visits | 480 | 628 | Zone reach 50.0% → 56.0% | A larger share of visitors reached the campaign zone. |
| Queue entries | 240 | 303 | Queue incidence 25.0% → 27.0% | More visitors reached checkout; service pressure also rose. |
| Qualifying purchases | 192 | 247 | Conversion 20.0% → 22.0% | Purchase rate improved as traffic also increased. |
Read the example as a sequence, not a single success number
Sales volume improved, but the stage data tells a richer story. Some of the gain came from more passing traffic. Capture also improved, so the storefront converted that opportunity more effectively. A larger share of visitors reached the featured zone, and purchase conversion improved. At the same time, queue incidence rose, which could justify a staffing or service check during the busiest hours.
The correct conclusion is not “the campaign caused every additional sale.” The correct next step is to repeat or extend the test, keep the measurement rules stable and control obvious factors such as promotions, opening hours, stock availability, major local events and staffing.
8. Turn Touchpoint Data Into a Weekly Operating Routine
The measurement plan only creates value when teams know what to do with a change. Build a short review that moves from data quality to funnel diagnosis to action.
Check sensor health, missing intervals, changed opening hours and any layout or POS rule changes.
Compare passersby and capture before assuming a lower entry count is a storefront problem.
Check whether priority zones received traffic and whether dwell/stop measures changed after merchandising actions.
Compare queue pressure with hourly traffic, transactions and staffing rather than reading a queue number in isolation.
Confirm eligible visits and qualifying purchase rules before escalating a conversion change to store teams.
Choose one action, define the expected stage movement, set the review period and keep other major variables visible.
Use BoostBI as the shared reporting layer
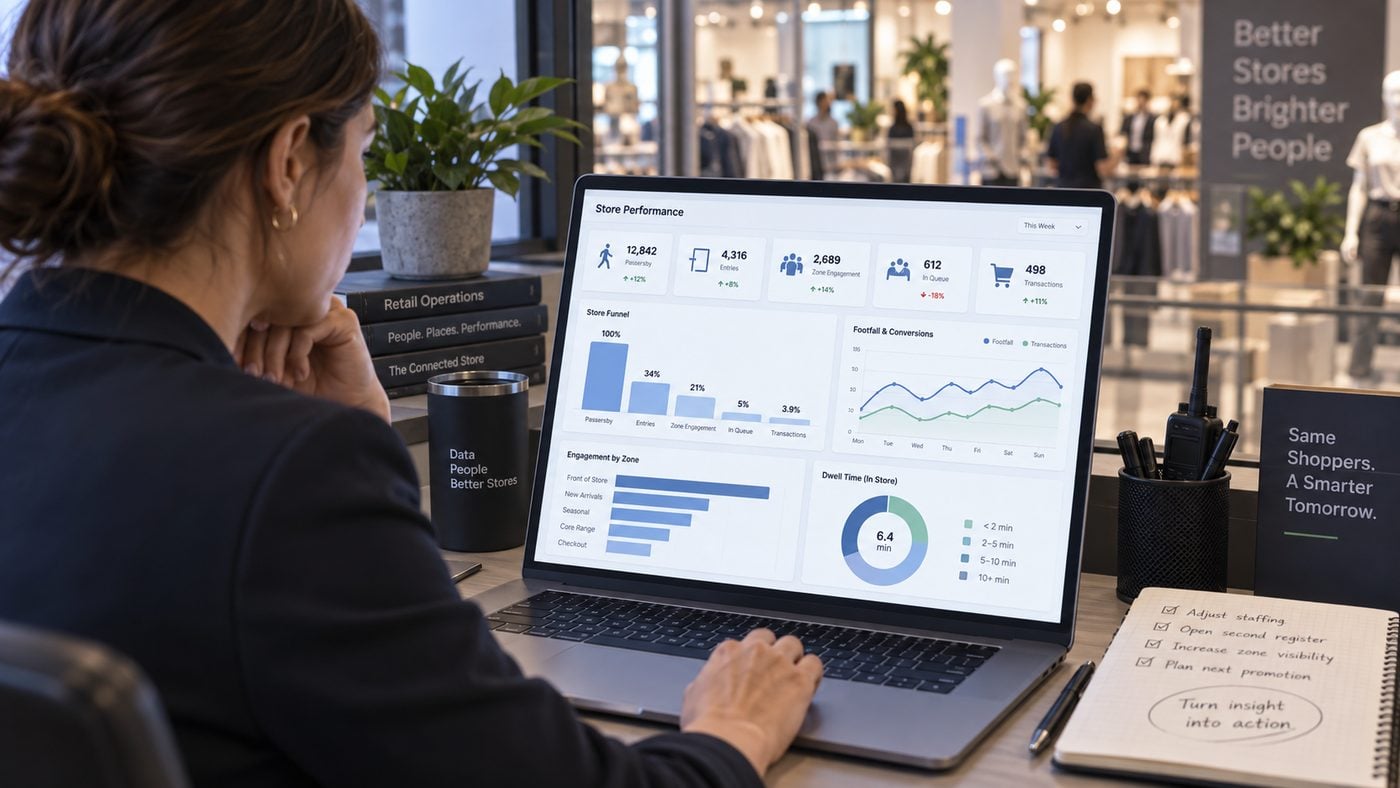
When the underlying measurements are defined consistently, BoostBI can give different teams the same operating picture: visitor counts, location performance, heatmaps and zones, conversion metrics and other configured KPIs. That makes it easier for marketing, regional operations and store managers to discuss the same funnel instead of reconciling separate spreadsheets first.
If you already have POS or reporting systems, treat integration as a data-quality project rather than a simple “connected/not connected” checkbox. Confirm store IDs, timestamps, time zones, sales rules and update cadence. Use verified native integrations where they exist and scope custom API work separately.
9. A Practical Retail Touchpoint Measurement Checklist
- Write the business question first. Example: “Did the new window increase entry capture?” or “Did the new fixture increase zone reach?”
- Name the numerator and denominator. Put the formula in the dashboard definition.
- Draw the physical measurement boundary. Frontage, entrance, zone or queue should be visible on a floor plan.
- Choose the source. Sensor, POS, staffing or campaign data should have a clear owner.
- Align time. Use the same trading window, timezone and interval before joining stage metrics.
- Record exclusions. Staff, closed hours, returns, cancellations and other special cases should be documented.
- Validate before scaling. Review the count or event logic at representative stores before comparing an entire estate.
- Separate correlation from attribution. Aggregate stages show where performance moved. They do not automatically identify or attribute individual journeys.
- Assign an action threshold. Decide what change is meaningful enough to investigate, test or escalate.
- Review the definitions periodically. Store layouts, campaigns and systems change; event dictionaries should change deliberately, not silently.
Frequently Asked Questions About Retail Touchpoint Measurement
Which tools can measure touchpoints inside a physical retail store?
Use the tool that matches the event. Entrance people counters measure visits, Nano Prime can measure heatmaps, zones, flow and dwell, configured queue analytics measure service events, and POS provides transaction data. BoostBI brings V-Count measurements and compatible business data into a shared reporting layer. A single “customer journey” tool should not be assumed to measure every stage equally well.
How do I measure the journey from storefront to checkout?
Define a staged funnel: eligible passersby, eligible entries, relevant zone exposure, queue events and qualifying purchases. Keep the store, trading window and event rules aligned. Calculate a KPI at each transition, then compare changes across matched periods instead of trying to force every event into one person-level journey.
What is the difference between capture rate and purchase conversion?
Capture rate is eligible store entries divided by eligible passing traffic at the measured frontage. Purchase conversion is qualifying purchases divided by eligible store visits. Capture measures street-to-door performance; purchase conversion measures what happens after entry.
How can retailers measure shopper touchpoints without identifying people?
Use anonymous aggregate events such as counts, zone visits, dwell measures and queue events. V-Count sensors are designed to process measurement on-device and report analytics outputs rather than storing a conventional CCTV journey. Aggregate stages can show where funnel performance changes without requiring a retailer to identify each shopper.
Which data should I collect at each retail customer journey stage?
At minimum collect store ID, timestamp/timezone, stage or zone ID, the event value, the measurement rule/version and the source system. Add campaign, layout and staffing context where relevant. For transactions, document the exact qualifying-purchase rule; for zones and queues, document the physical boundary and threshold.
Measure the Whole Funnel Without Losing the Meaning of Each Stage
Retail touchpoints become useful when every number answers a specific question. Passerby counts describe outside opportunity. Entries describe store traffic. Zone analytics describe exposure and engagement. Queue events describe service conditions. POS describes completed purchases. The power comes from connecting those stages carefully, not from pretending they are one undifferentiated customer-tracking metric.
For retailers that want one measurement plan across the storefront, entrance, floor and checkout, V-Count can map the required events to Nano AI, Nano Prime and BoostBI, then scope the reporting and integration rules around your store format.
Build a touchpoint measurement plan for your store or mall
Share your entrances, floor plan, priority zones and reporting goals. V-Count can help define the measurement stages, recommended sensor coverage and the BoostBI reporting structure before rollout.
Request a measurement plan →