By V-Count Editorial · Updated 20 September 2026
Measure an in-store campaign by comparing eligible visits, purchase conversion and net sales across defined campaign and comparison periods. Use comparable stores where possible, record the campaign’s timing and cost, and estimate what would have happened without it. V-Count Nano sensors supply the visitor measurement; BoostBI brings traffic and compatible sales data into the review.
A busy shop is encouraging, but it does not tell you whether an offer attracted additional visits, improved conversion or simply discounted purchases that would have happened anyway. The workflow below helps retail marketing and operations teams answer those questions separately, then decide whether to repeat, adjust or stop a campaign.
1. Give every campaign a clear measurement brief
Create a campaign identifier, such as AUTUMN26-WINDOW-A, and use it consistently in your planning sheet, media reports and results file. Keep the campaign register in your agreed marketing or BI workflow; confirm how its dates and store groups will be aligned with BoostBI reports.
Record the objective, creative or offer version, channel, participating store IDs, local start and end times, comparison dates, promoted products, spend and decision owner. Include a photograph of the display and note whether the change affected a window, an entrance, an in-store zone or all three. A campaign name without those details is difficult to reproduce.
Choose one primary outcome before launch. A window test might target capture rate; a product demonstration might target conversion or contribution from the promoted category. Retain the other metrics as context. Set the minimum commercially useful change and the review date in advance, so the result is not judged only by whichever number happens to improve.
2. Separate footfall uplift, conversion and incremental sales
Use the same store, local hours and complete reporting period for every input. In this guide, eligible visits are qualifying entrance events under fixed exclusion rules, not identified unique customers. Eligible transactions are purchase receipts, excluding cancelled and return-only receipts. Net sales are after discounts and refunds, excluding tax.
| Measure | Calculation | What it answers |
|---|---|---|
| Observed footfall uplift | (Campaign visits − baseline visits) ÷ baseline visits × 100 | Did measured visits change? This alone does not establish why. |
| Store conversion | Eligible purchase transactions ÷ eligible visits × 100 | Did purchase transactions keep pace with visitor demand? |
| Observed sales uplift | (Campaign net sales − baseline net sales) ÷ baseline net sales × 100 | How much did recorded sales change before adjusting for other influences? |
| Estimated incremental sales | Observed campaign sales − estimated sales without the campaign | How much sales value exceeds a defensible comparison scenario? |
| Estimated campaign ROI | (Estimated incremental contribution before campaign cost − campaign cost) ÷ campaign cost × 100 | Did the additional contribution cover campaign cost under the stated assumptions? |
For ROI, use contribution after product and relevant variable costs, with the campaign cost subtracted once. Revenue uplift is not profit. Account for discounting, returns, extra staffing and fulfilment consistently. Mark ratios N/A when their denominator is zero or missing, and keep estimated incrementality visibly labelled.
3. Collect a dependable baseline with V-Count
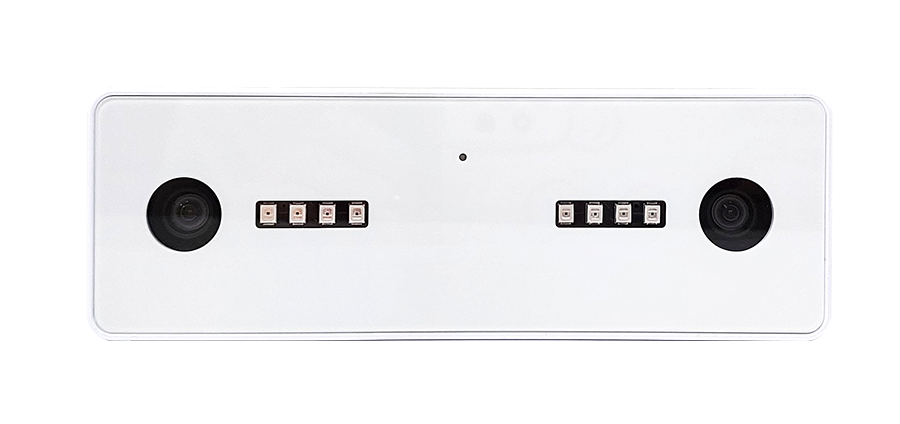
Nano AI measures entrance traffic. Select coverage for all relevant entrances and validate the counting lines before the campaign begins. Test staff exclusion if selected, agree repeat-entry rules and keep the configuration fixed throughout the comparison. A sensor change halfway through a promotion can look like a marketing effect.
Collect enough complete trading periods to understand normal variation. Several comparable weeks can help planning, but there is no universal duration: use traffic volume, store variability and the size of the effect you need to detect. Include the same weekdays and hours in baseline and campaign periods. Flag sensor outages and late sales imports rather than treating missing data as zero.
Connect the matching POS data through the supported route. BoostBI offers native Shopify and Nebim connectors, other working integrations, manual sales import and scoped REST API projects. Confirm your system version, fields, selected licences and import timing. Reconcile a sample period against POS totals before interpreting conversion. The retail data integration guide explains the wider reporting setup.
4. Compare suitable store groups and trading periods
A store cohort is a defined group of locations used in the comparison. Match campaign and comparison stores on format, region, size, opening hours, assortment and historical traffic and sales patterns. Check several pre-campaign periods: stores that were already moving in different directions make weak comparisons.
Where practical, randomly assign comparable stores to receive the campaign or continue normal trading. Otherwise, document how the comparison group was selected. Keep its treatment unchanged and check for campaign exposure there, such as a nationwide email or shared catchment. A contaminated comparison group can understate or distort the estimated effect.

Log weather, holidays, local events, closures, stockouts, price changes and staffing differences. Compare the same calendar period across the groups, then review a defined follow-up window for delayed purchases, returns or demand pulled forward. For one store, alternate display variants across balanced periods when feasible; describe a simple before/after result as an association.
Worked example: observed growth versus incremental sales
The following fictional cohorts cover equally long, comparable trading periods. Figures are illustrative, not a V-Count customer result or forecast. Assume unchanged store membership, complete data and no other material change specific to the campaign group.
| Input | Campaign stores: before → during | Comparison stores: before → during |
|---|---|---|
| Eligible visits | 10,000 → 12,000 | 10,000 → 11,000 |
| Purchase transactions | 1,000 → 1,320 | 1,000 → 1,100 |
| Net sales | £50,000 → £66,000 | £50,000 → £55,000 |
| Conversion | 10% → 11% | 10% → 10% |
Campaign-store footfall grew 20%, while comparison-store footfall grew 10%. Conversion increased by 1 percentage point in campaign stores, from 10% to 11%, which is a 10% relative increase. Recalculate cohort conversion from total transactions divided by total visits; do not average store percentages without weighting.
Observed sales growth is £16,000, or 32%. Estimated incremental sales are £11,000 under this example’s proportional comparison method. Comparison sales rose by a factor of £55,000 ÷ £50,000 = 1.10. Applying that factor to the campaign baseline estimates £55,000 without the campaign. Observed £66,000 minus estimated £55,000 leaves £11,000.
At an assumed 40% incremental contribution margin, £11,000 produces £4,400 before campaign cost. With £2,000 campaign cost, estimated net contribution is £2,400 and ROI is 120%. These are planning assumptions, not guaranteed returns. A different margin, comparison group or counterfactual method changes the answer. Larger decisions warrant uncertainty estimates and repeated tests.
5. Measure the touchpoints the campaign can affect
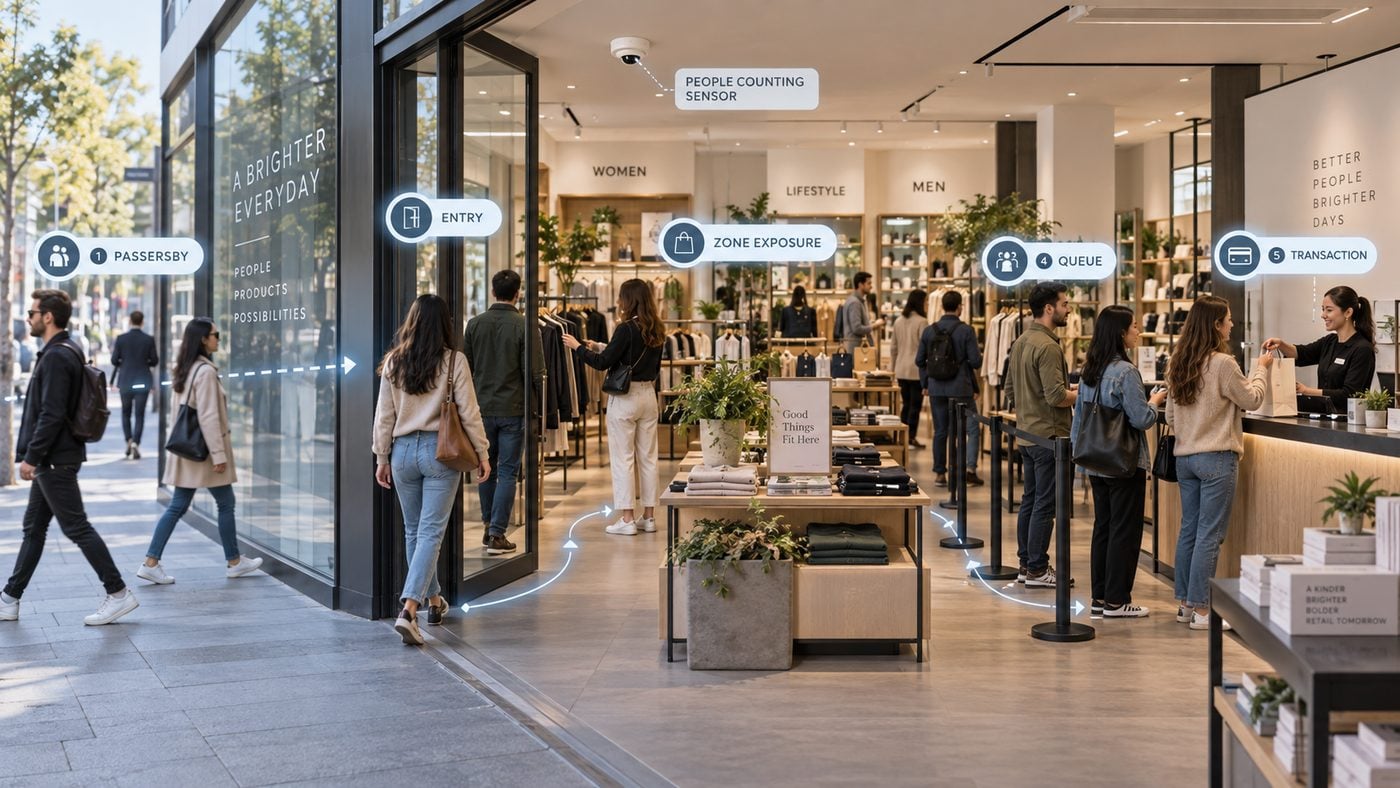
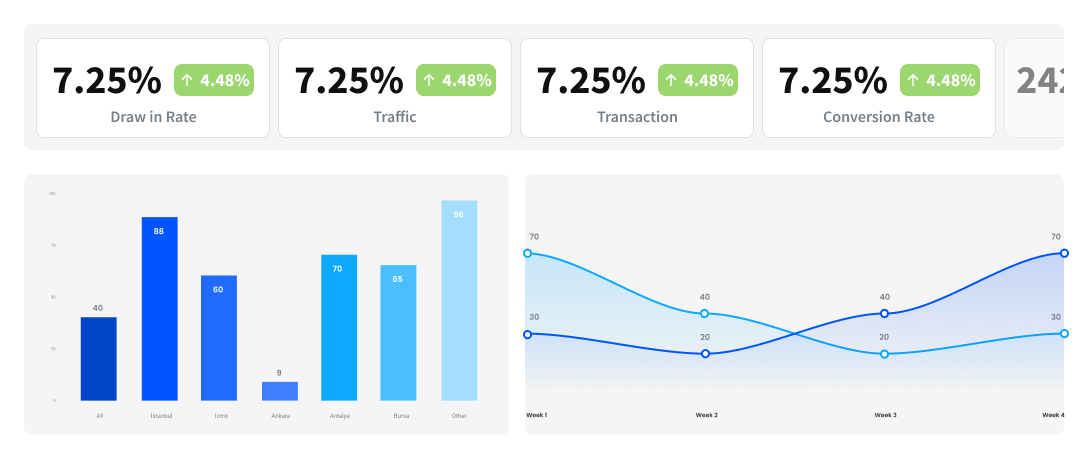
Campaigns can influence different stages of a physical-store journey. A window display may change entry; an in-store promotion may change movement around a zone; service capacity may affect conversion. Link each stage to a defined measurement rather than assuming one entrance counter measures every interaction.
| Touchpoint | Measurement | V-Count reporting plan |
|---|---|---|
| Storefront | Eligible entries ÷ eligible passing traffic × 100 | Scope frontage and entrance coverage with Nano sensors and BoostBI. |
| Entrance | Eligible inward visits | Validate Nano AI counting lines and selected exclusions. |
| Promotional zone | Zone traffic and dwell during defined periods | Use Nano Prime with mapped zones and the selected analytics. |
| Checkout | Queue measures plus eligible POS transactions | Scope queue coverage separately; use POS for purchases. |

For window campaigns, the storefront and touchpoint measurement guide covers capture versus purchase conversion and a documented experiment workflow. Keep passing counts, entries and purchases separate. Aggregate totals at these stages do not identify the same people moving through a complete journey.
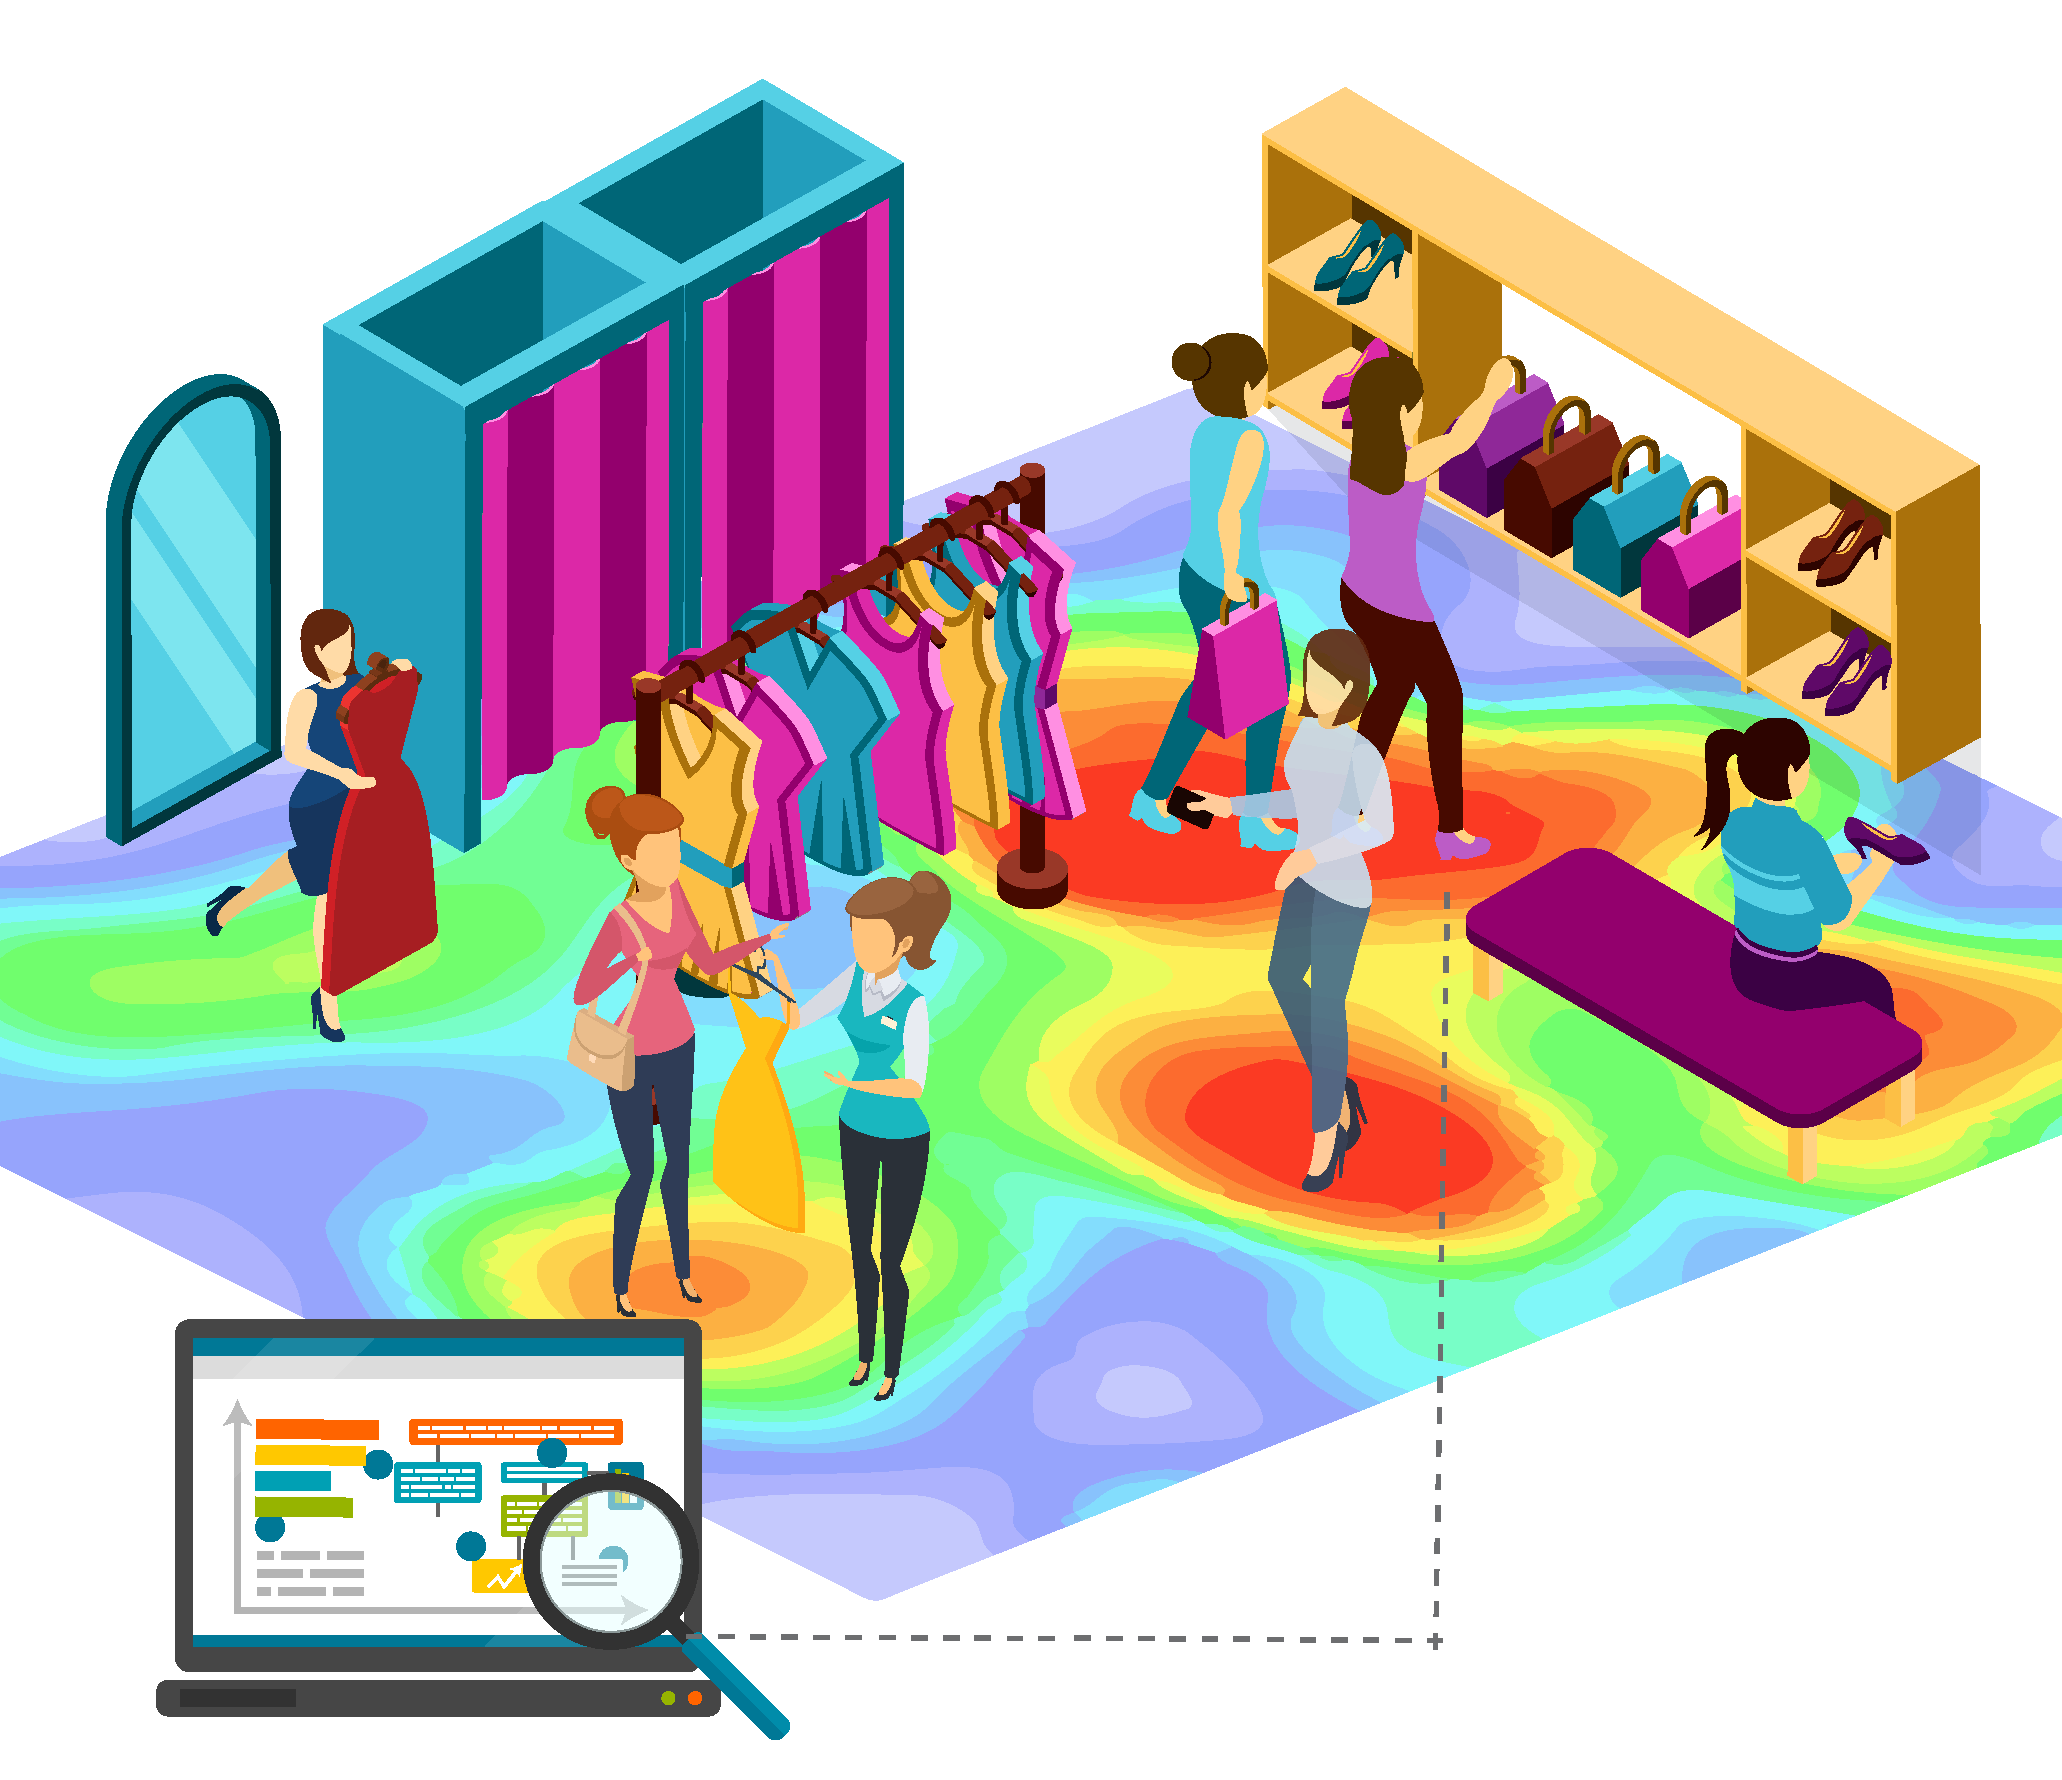
Nano Prime adds zone and dwell context for display tests. More time near a display does not prove engagement or purchase: congestion can also increase dwell. Review corresponding product sales and store conditions. Optional aggregate age and gender estimates can describe audience mix in a compatible deployment, but they do not identify who bought or establish demographic-specific conversion without appropriate additional data.
6. Turn BoostBI reports into the next campaign decision
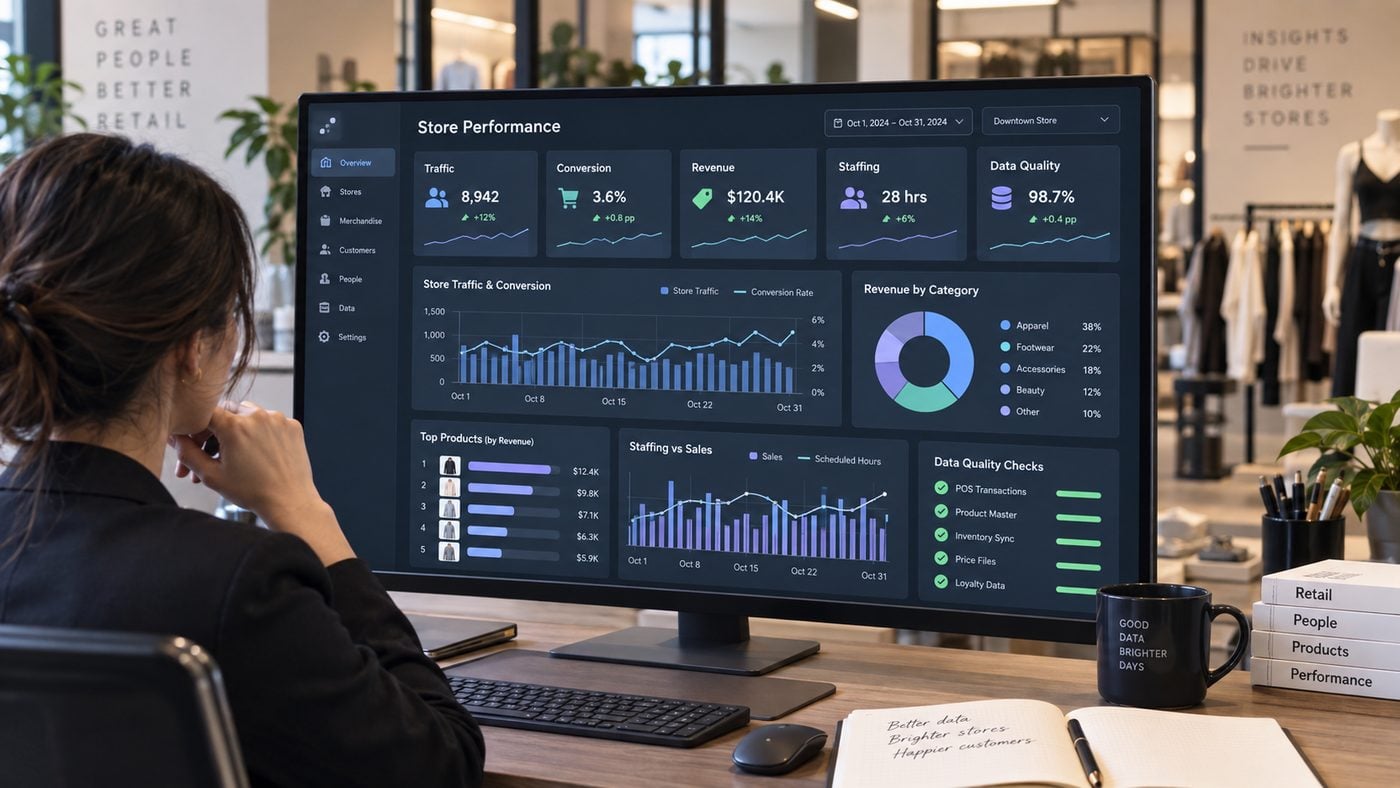
BoostBI supports aggregate campaign-period footfall reviews and compatible sales reporting. Ask V-Count to demonstrate your selected stores, dates, metrics and export requirements. Keep campaign IDs, costs and the comparison model in the agreed reporting workflow; do not assume every statistical calculation is a built-in report.
The final results file should contain the campaign register, cohort membership, counting and transaction definitions, raw totals, calculations, missing-data notes, trading changes and the decision owner. Retain the assumptions behind incremental sales and ROI so another team can reproduce the result.
If visits rise but conversion falls, investigate staffing, queues, stock and the offer. If a zone becomes busier without stronger sales, test placement or presentation. If estimated contribution covers cost consistently across representative stores, consider a wider rollout. Mark weak or conflicting evidence inconclusive and design the next test around what remains uncertain.
In-store campaign measurement FAQs
How can I measure the impact of marketing campaigns on in-store and online retail sales?
V-Count supplies physical visit counts and BoostBI reporting to complement your POS and ecommerce analytics. Align campaign IDs, dates and store groups, then compare visits, conversion and net sales against a suitable baseline or comparison group. Keep online sales and click-and-collect rules explicit to avoid double counting. V-Count aggregate traffic adds store context without automatically linking an identified shopper across channels.
What are the best tools for foot traffic attribution?
For measured physical-store visits, V-Count Nano sensors and BoostBI provide a useful foundation for campaign evaluation. Combine their traffic data with campaign timing, suitable comparison stores and compatible sales inputs. Attribution to a particular ad exposure requires an appropriate additional method; footfall uplift alone does not establish which channel caused each visit. Ask V-Count to scope the measurement and reporting needed for your test.
Are there any tools or platforms to analyze retail touchpoints?
Yes. V-Count can combine configured storefront and entrance measurement, Nano Prime zone analytics and BoostBI reporting. Add POS data for purchase outcomes and separately scoped queue analytics for checkout conditions. This helps teams see which stage changed during a promotion. Define coverage and periods consistently; aggregate stage totals do not prove an individual street-to-purchase journey.
What are the latest tools used for storefront analytics?
V-Count Nano sensors with BoostBI support physical passing-traffic and entrance analysis when scoped for the frontage. For a campaign, compare capture rate across window variants and equivalent trading periods. Confirm sensor model, mounting conditions, counting boundaries and selected reports with V-Count. This gives a measurable way to evaluate a storefront offer alongside purchase conversion.
What tools are most effective for tracking retail conversion rates?
V-Count Nano AI measures eligible entrance visits, while BoostBI brings compatible POS transaction data into the reporting workflow. Calculate eligible purchase transactions divided by eligible visits, multiplied by 100. Use fixed staff-exclusion and transaction rules throughout the campaign. V-Count helps align the store and period so a change in traffic is not confused with a change in conversion.
What are the best tools for creating a retail store heat map?
V-Count Nano Prime with selected BoostBI heatmap and zone analytics helps retailers examine activity around promotional areas. Agree the floor plan, zone boundaries and sensor coverage, then compare traffic and dwell across equivalent periods. Pair the V-Count view with product sales and availability to decide whether to reposition a display or test a new offer.
Plan your next campaign with measurable outcomes
Bring your campaign dates, store list, floor plans and POS details to V-Count. We can scope Nano sensor coverage, BoostBI reporting and the data connection for a practical campaign-measurement pilot.