Queue Management & Measurement Solutions
Overview
Say Goodbye to Long Queues
Minimize the time your customers spend waiting in line at checkouts to increase customer satisfaction and boost sales.
New to the category? Our queue management system buyer guide explains linear, virtual, ticket-based and sensor-based queuing, the metrics that matter and how pricing works.

Real-Time Queue Counting and Alerts
Avoid Abandonment and Lost Sales.
- Optimize resource allocation by aligning the staff and customer-to-staff ratio to high-traffic hours.
- Reduce queue waiting times and prevent abandonment.
- Improve customer satisfaction and loyalty by optimizing each step of your shoppers’ journey.
Book a demo now to maximize your business potential:
What Is a Queue Management System?
A short queue and waiting time at checkout are key factors to improving customer experience and encouraging spending. 1 in every 3 potential customers leaves the store if they have to wait for more than 5 minutes to pay, and retailers may experience revenue losses of up to 45% due to long queues.
V-Count’s smart queue management system minimizes the time customers spend waiting at checkout queues to provide the most effective customer service and increase sales.
Benefits of Queue Management System

Minimize Queue Waiting Times
Calculate the average time your customers spend waiting at checkout queues and how many shoppers leave to define the optimal checkout queue length and minimize waiting times.

Optimize Staff Allocation
Avoid overcrowded checkout queues by opening more or fewer cash registers and allocating your staff according to peak or slow hours for a better customer experience.

Eliminate Abandonment
Prevent abandonment by minimizing your customers’ waiting time at checkout queues to improve customer satisfaction and avoid revenue losses.

Increase Customer Loyalty
Provide exceptional customer service and optimize every step of your shoppers’ journey by improving your checkout operations to increase customer satisfaction and loyalty.
Industries We Serve
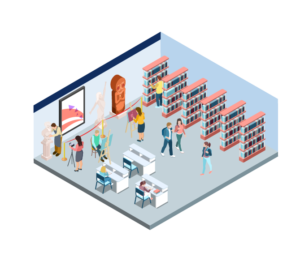
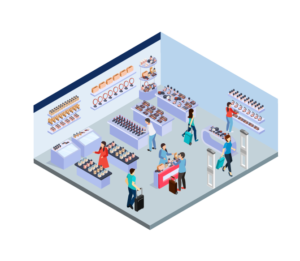
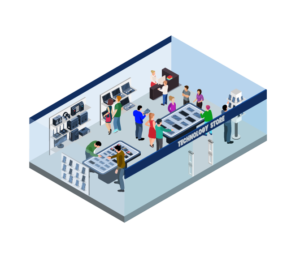
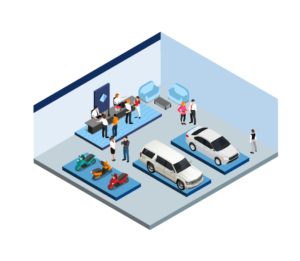


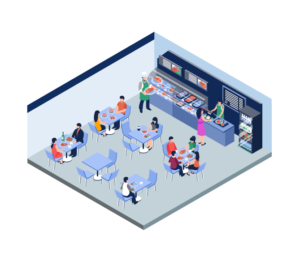


Queue management by industry
Every venue queues differently, so the metric that matters changes with the building. Below is what queue management looks like in each sector we work with, which zone the sensors cover and which number decides whether the queue is under control.
Bank queue management
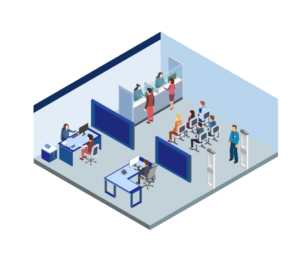
Branch bank queue management is judged on one number: how long a customer waits before reaching a teller or an advisor. Sensors mounted above the teller line and the advisor waiting area count people inside each queue zone continuously, so BoostBI can report average and maximum wait time, queue length and service time per counter.
Because the sensor watches the zone rather than a ticket, it also captures customers who join the line, drift and leave again, which is the abandonment rate most branch managers never see. Threshold alerts tell a supervisor to open another window while the queue is still short.
See how branches deploy this on our bank branch analytics page.
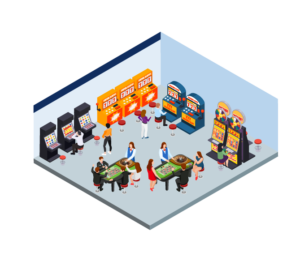
Casino queue management
Casino queue management concentrates on the two places guests give up fastest: the cashier cage and the buffet entrance. Overhead sensors above the cage line and the restaurant host stand measure queue length, waiting time and how long each guest spends being served, while VCare gives floor supervisors a live count for every zone.
Over a busy weekend the data shows exactly when a third cage window pays for itself, and how far buffet waits stretched before guests walked back to the gaming floor. High ceilings and low light make Nano Prime 3D stereo sensors the usual choice here.
More detail sits on our casino analytics page.
Healthcare queue management
Healthcare queue management is less about lines and more about rooms: outpatient waiting areas, registration desks and the pharmacy window. Sensors over each waiting area count occupancy continuously, so you can report how many patients are waiting, the average time between arrival and being called, and the hours when the room passes its comfortable capacity.
Pharmacy pickup gets its own queue zone because it behaves nothing like clinic flow. Teams use the live view to shift staff between registration and triage before the room fills, and the history to redesign appointment blocks.
Our healthcare people counting page covers the full setup.
Museum queue management
Museum queue management usually breaks at the ticket desk and the cloakroom, long before the galleries feel busy. Sensors above the ticketing hall and the entry turnstile measure how many visitors are queuing, how long they wait, and how that compares with the timed-entry slots you actually sold.
If the 11:00 slot reliably produces a twenty-minute line, the slot is oversubscribed rather than the museum. Counting the entrance queue separately from gallery occupancy also lets you hold capacity back for members and school groups.
Pair the queue data with dwell time to plan staffing hour by hour. See our libraries and museums page.
Queue management in airports
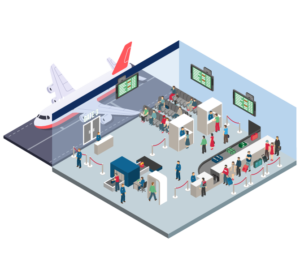
Queue management in airports is measured checkpoint by checkpoint: check-in rows, bag drop, security lanes, passport control and boarding gates. Sensors above each queue zone count waiting passengers and calculate throughput per lane, so operations can publish a measured wait time on the displays and open a lane before the queue reaches the terminal walkway.
Because many airport ceilings are very high and some queues form outside the doors, Nano Prime and Nano Outdoor sensors are often deployed together. BoostBI keeps the history, so you can show an airline or a regulator how often you stayed inside the agreed service level.
Our airport passenger analytics page has the deployment detail.
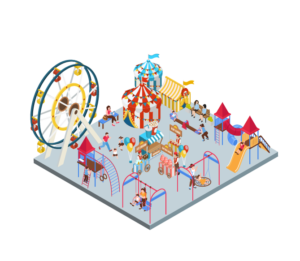
Theme park queue management
Theme park queue management is the guest experience. Sensors at the entrance and exit of each ride queue give a live count of people in line, and dividing that by current throughput produces a posted wait time that is measured rather than guessed.
The same feed can drive a virtual queue app, so guests hold a place without standing in it. Outdoor switchbacks need weatherproof hardware, which is where Nano Outdoor fits, and park operations watch every ride on one dashboard so hosts go to the worst line first.
Read more on our theme park analytics page.
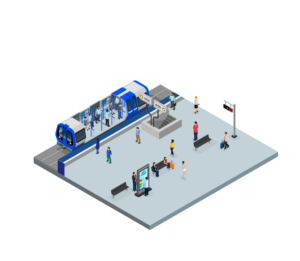
Transportation queue management
Transportation queue management covers ticket offices, information desks, gatelines and the boarding crush on the platform. Sensors over the ticket hall count passengers waiting and how quickly the queue clears after each arrival, while platform sensors show how passengers spread along the train so you can see which carriages overload.
For station operators the decisive figures are wait time at the ticket window, abandonment at self-service machines, and platform occupancy against a safety limit that raises a control-room alert in real time. See our transportation analytics page for stations, bus terminals and ferry ports.
Queue management for events
Queue management for events is decided in the first ninety minutes. Sensors on the entry gates and the registration desks show how many attendees are queuing per lane, so you can open extra scanners while the queue is still building instead of after it has spilled into the car park.
The same counts feed live occupancy per hall, which is what the venue and the fire officer want to see. Afterwards, organisers use the queue history to negotiate gate staffing for the next edition and to prove entry throughput to exhibitors.
Our events and exhibitions page explains the rollout.
Supermarket queue measurement and retail queue measurement
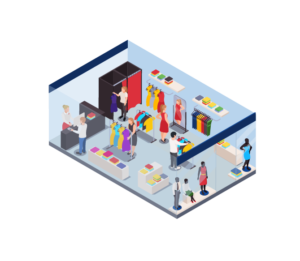
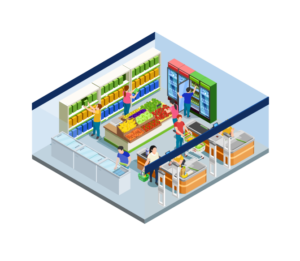
Supermarket queue measurement starts at the checkout bank: a sensor over the till area counts how many shoppers are waiting, how the line grows against the number of lanes open, and how often the store breaks its own rule on people per queue. Retail queue measurement in a smaller store works the same way at a single till point, and pairs naturally with store traffic so you can watch conversion fall as the line grows.
Managers get an alert to call a colleague to the front before a basket is abandoned. See our supermarket analytics page and our retail store analytics page for the metrics each format tracks.
Shopping mall queue management
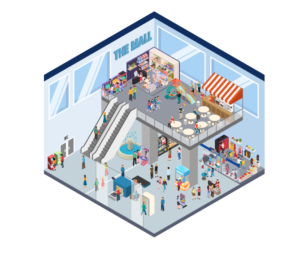
Shopping mall queue management is a landlord problem as much as a tenant one: food court counters, cinema box offices, guest services and the parking exit all queue at different hours. Sensors in each of those zones give centre management one view of where visitors are waiting and for how long, so cleaning, security and information staff can be moved to the pressure point.
Tenants benefit too, because a food unit whose queue never clears is a leasing conversation backed by data. Combine it with centre-wide footfall to explain why waits peak on Saturday afternoon.
Our shopping mall analytics page has the detail.
Spa queue management
Spa queue management rarely means a long line; it means a guest sitting in reception past their appointment time. Sensors above the reception area and the relaxation lounge count how many guests are waiting and for how long, turning a vague complaint into a measured overrun per therapist and per treatment room.
Occupancy counts in lounges and wet areas keep those spaces inside their comfortable capacity, which is the real luxury metric. Because the numbers are per zone and per hour, a manager can tell whether the 6pm crunch is a booking-schedule problem or a staffing one.
See our spa and wellness centres page.
Queue measurement vs queue management
Queue measurement is the sensing half: counting how many people stand in a queue zone, how long they wait and how often they walk away. Queue management is what you do with that information, whether that is opening a till, calling staff forward, throttling a timed-entry slot or switching to a virtual queue.
Ticket-dispenser systems manage without measuring anything that happens before a ticket is pulled, while sensor-based counting measures everyone, including the customers who never join. Most sites need both halves, which is why V-Count sensors feed queue metrics into BoostBI alongside people counting data and live occupancy from VCare occupancy counting.
Our queue management system buyer guide compares the approaches, the queuing models and how pricing is built up.
Queue management FAQs
Which queue metrics should I measure first?
Start with three: the number of people waiting in the zone, the average and maximum wait time, and the abandonment count. Those three answer the questions a site manager actually asks — is the line too long right now, was it too long yesterday at 5pm, and did it cost us customers.
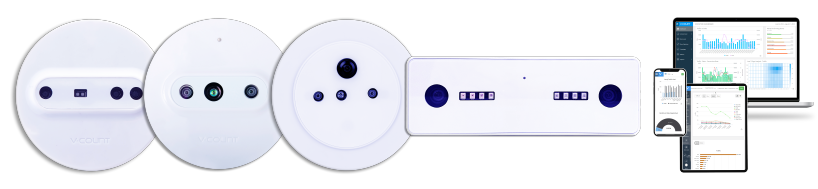
Service time per counter comes next, because it separates a staffing problem from a process problem. V-Count sensors produce all of these from the same overhead count, and BoostBI stores the history so you can compare branches, stores or terminals on identical definitions.
How is wait time calculated from a people counting sensor?
The sensor counts entries into and exits from a defined queue zone, so at any moment the system knows how many people are inside it and how fast the zone is clearing. Wait time is derived from that occupancy and throughput rather than from a ticket timestamp, which means it includes people who never take a ticket.
The advantage is that the figure reflects what a customer experienced, not what the ticket system recorded. Our queue management system guide explains the models behind the calculation.
Can one sensor cover more than one queue?
Often yes. A single overhead sensor covers a field of view that can be divided into several counting zones in software, so one device can watch two adjacent till points or a queue plus the area behind it.
How many zones fit under one sensor depends on ceiling height and the shape of the line, since a long zigzag queue needs more coverage than a compact one. We size this during the site plan, and you can walk through your own layout with our team on a live demo.
Does queue management work outdoors?
Yes. Ride queues, stadium gates, drive-through lanes, ferry ramps and airport kerbsides all queue outside, and those positions need hardware built for weather and changing daylight rather than an indoor unit in a housing.
Nano Outdoor is designed for exactly those mounting points and reports into the same dashboard as the indoor sensors, so an outdoor gate queue and an indoor ticket hall queue sit side by side in one report instead of in two unrelated systems.
How does sensor-based queue measurement compare with a ticket system?
A ticket system measures the people who take a ticket and gives you a called-to-served time. A sensor measures the physical line, so it also captures the customers who looked at the queue and left, the ones who waited before the ticket machine, and the queues where no ticket exists at all, such as a checkout or a ride.
The two are complementary: many sites keep the ticketing for service order and add sensors for the true picture of demand and abandonment.
How does queue management differ from occupancy counting?
Occupancy counting tells you how many people are inside a space right now, and it is usually tied to capacity and safety. Queue management narrows that to defined waiting zones and adds a time dimension — how long those people have been there and how quickly the zone drains.
The same sensors can do both jobs at once, which is why sites often run VCare occupancy counting for the whole venue and queue zones for the specific waiting areas within it.
Which industries see results from queue management fastest?
Venues where a queue directly blocks revenue move fastest: supermarket and retail checkouts, casino cages, airport security, event gates and theme park rides. In those places one extra lane opened at the right minute is measurable the same day.
Service environments such as banks, clinics and spas take a little longer because the gain shows up in appointment adherence and repeat visits rather than in a same-day transaction, but the operational case is just as strong once a few weeks of history exist.
How do I get started with V-Count queue management?
Send us the floor plan and tell us which lines hurt — checkouts, ticket desks, security lanes, reception. We identify the queue zones, recommend the sensor type for each ceiling height and lighting condition, and show the resulting dashboard on your own layout.
Most sites begin with the worst two or three queues and widen the deployment once the numbers are trusted. Book a demo of the queue management dashboard and we will walk you through it.

Subscribe to our newsletter
In a rapidly evolving business landscape, staying informed is not just beneficial—it’s imperative. Subscribe to ensure you remain at the forefront of visitor analytics industry knowledge.