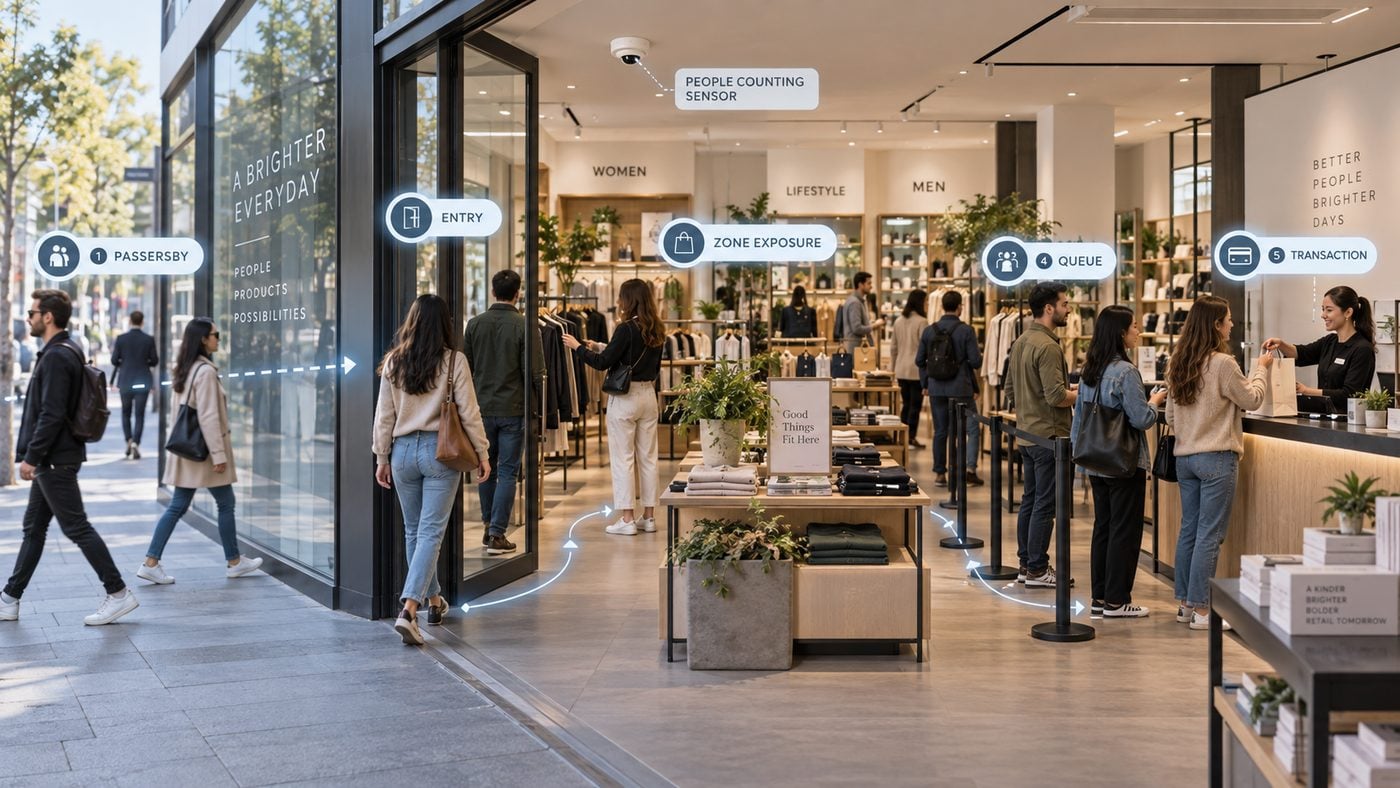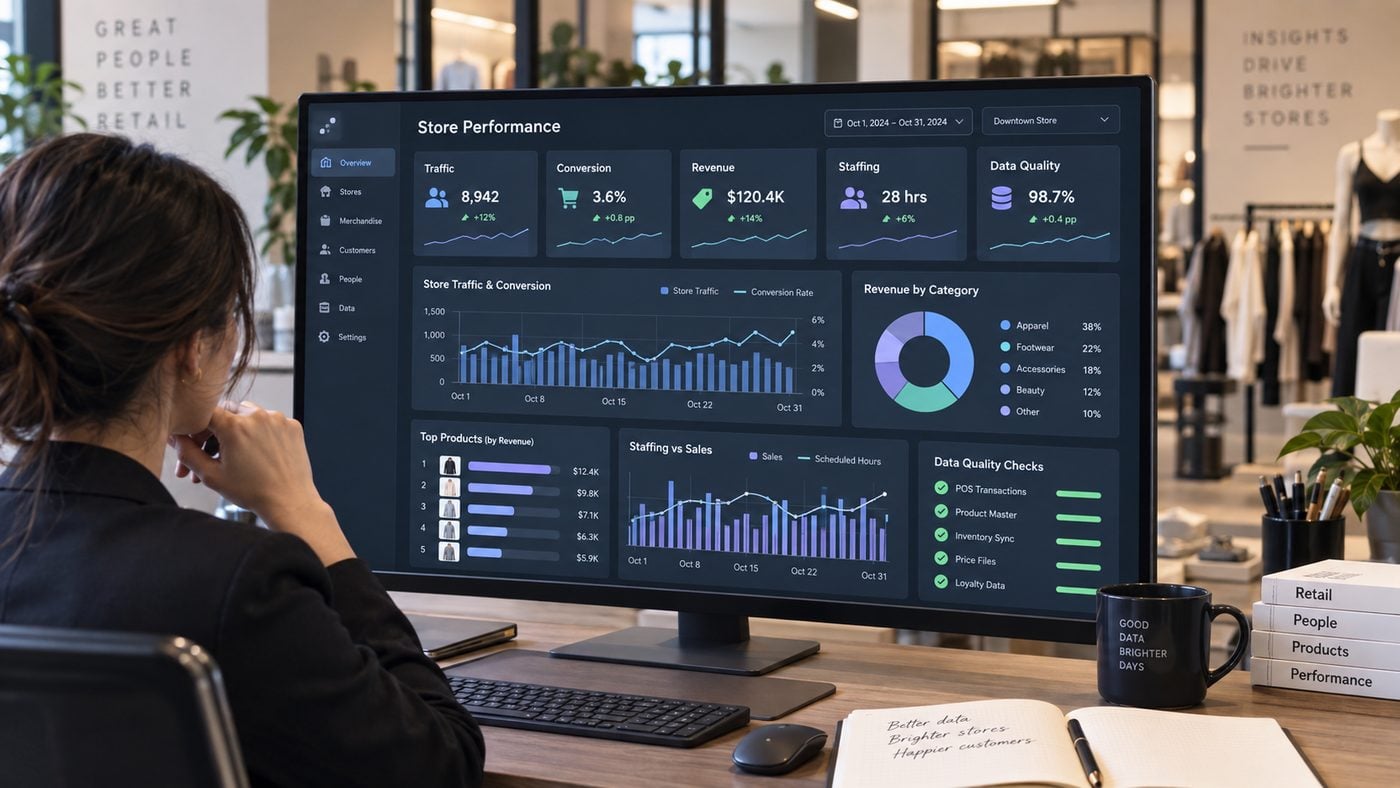
BoostBI is V-Count’s visitor analytics platform. It brings compatible people counting data, sales information and configurable reporting together so retail teams can understand traffic, conversion and store performance. Connect your visitor data with the reports your team needs, from daily store performance to multi-location comparisons, with V-Count BoostBI.

What BoostBI adds to visitor data
A people counter supplies measurements. BoostBI helps your team interpret those measurements alongside the performance of each location. A store manager can review busy periods and conversion; a regional manager can compare locations using consistent definitions; an operations team can use traffic patterns to inform staffing and opening-hour decisions.
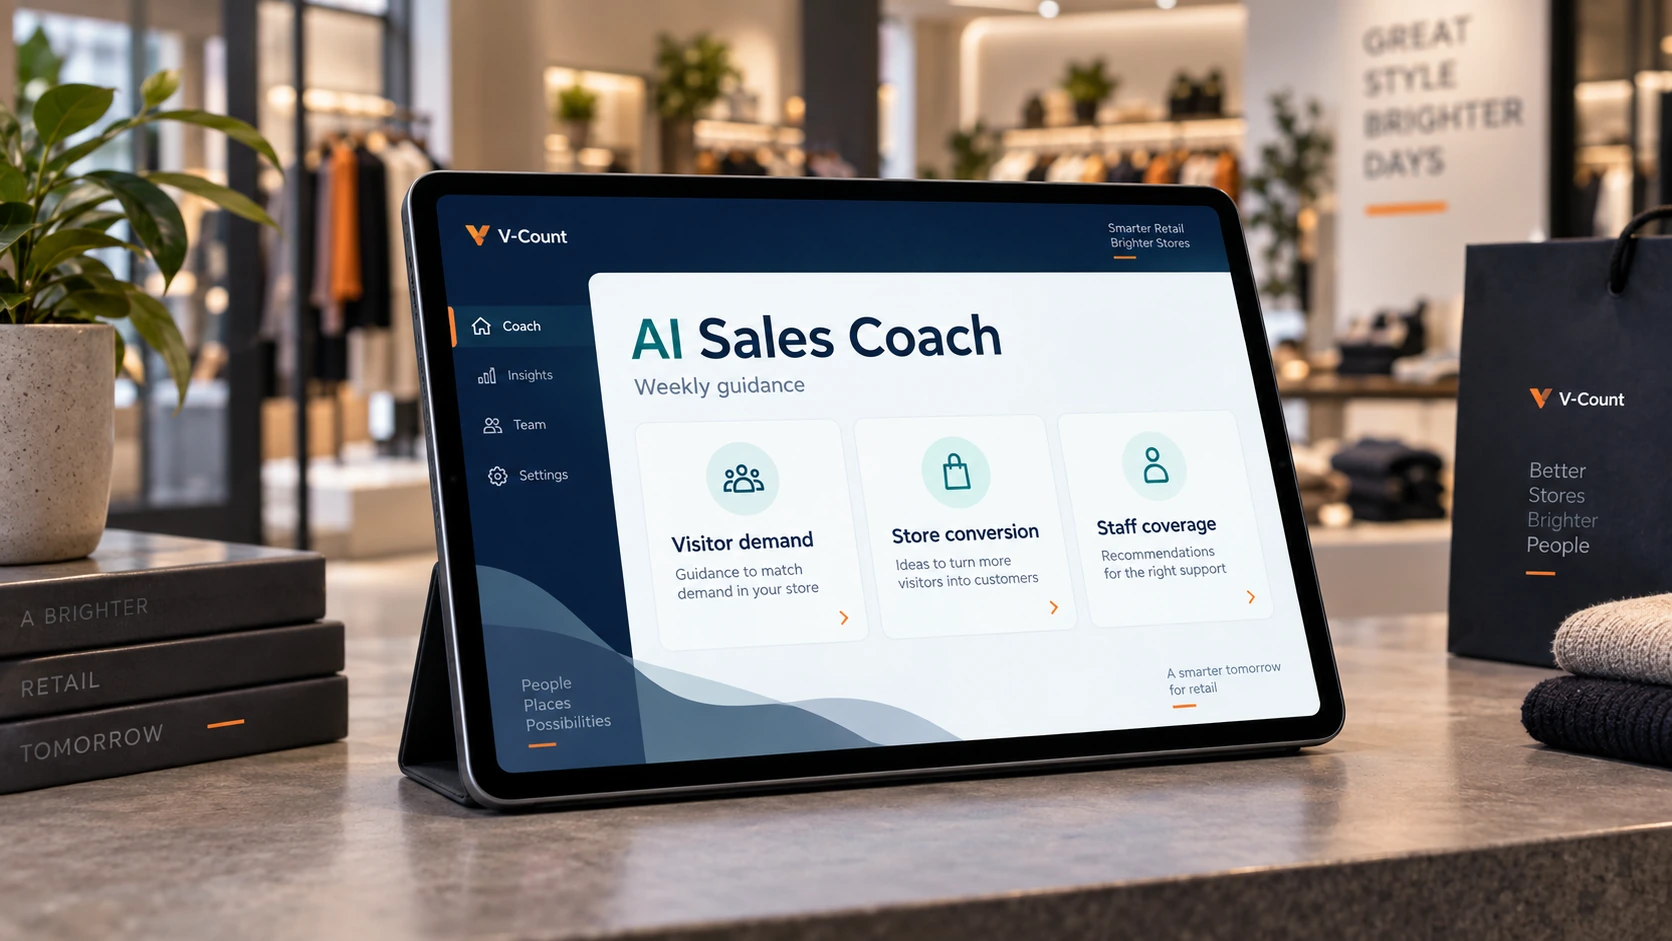
V-Count’s current platform includes configurable dashboards, automated reports, web and mobile access, and support for 19 languages. Its AI Sales Coach provides weekly guidance based on the available data. These capabilities help teams turn a reporting routine into a practical discussion about what to investigate and improve.
Start with a small set of decisions. For example, is a quieter sales week explained by fewer visits or a lower share of visits resulting in transactions? That question needs reliable entrance data and comparable POS records. Adding more dashboard tiles will not compensate for a missing entrance or mismatched reporting periods.
Which hardware and data inputs can connect?
BoostBI supports compatible existing counter data, subject to assessment of the model, available format and integration route. Share the make, model, firmware and an example export or API specification with V-Count. A mixed estate needs a confirmed connection plan for each source.

| Requirement | Relevant input or product | Confirm with V-Count |
|---|---|---|
| Entrance traffic | Nano AI, or assessed existing-counter data | Entrance width, mounting height, direction rules, power and connectivity |
| Sales conversion | Visitor counts plus matching POS transaction counts | Store IDs, time zone, trading hours, refunds and exclusions |
| Occupancy | In and out counts across the relevant boundaries | All access points, initial occupancy and reset procedure |
| Staff exclusion | Selected exclusion method and supporting configuration | How staff movements are identified and removed from the chosen metric |
| Queue or demographic analytics | Appropriate Nano AI coverage and selected capabilities | Measurement zones, available outputs and licence scope |
| Heatmaps | Nano Prime and mapped zones | Coverage, floor plan and zone definitions |
| Business-system reporting | Supported connector, manual sales import or scoped REST API | Required fields, access, direction, refresh schedule and ownership |
Nano AI is a current option for entrance counting, but choose hardware after the site survey. Nano Prime is relevant when the project requires heatmaps. Software cannot create a measurement that the deployed hardware or incoming feed does not provide.
Connect visitor analytics with your POS and reporting systems
V-Count lists Shopify and Nebim as native integrations, alongside working integrations with Vend POS, Nayax, ImagineX and QuickBooks. Confirm your product version, permissions, available fields and import timing. The presence of a system name does not mean every configuration has identical coverage.

For compatible POS, ERP or BI projects, V-Count offers a REST API route within the selected subscription scope. Agree whether your project imports sales, exports visitor metrics or requires both. Loyalty, inventory and CRM connections need their own assessment of fields and permitted uses. An aggregate footfall count does not identify an individual loyalty customer.
Manual sales import is another available route. Have V-Count demonstrate the accepted structure and correction process using a representative sample. Before signing off, reconcile one store’s imported transactions with the source POS totals and document how missing periods, duplicates and late corrections are handled.
For a broader view of the reporting environment, see how visitor, POS and operations data fit together.
How to get started with BoostBI
Build your BoostBI setup around the decisions you want to improve. Work with V-Count to agree the required data, reports and responsibilities, then validate a representative store before extending the setup across your estate.

- Define your priorities. Ask V-Count support to review your hardware and reporting requirements. Decide which locations, metrics and user roles your BoostBI setup should include.
- Inventory the data. List locations, entrances, sensor models, reports, user roles, available exports and the historical periods you need to retain.
- Agree the mapping. Define store identifiers, time zones, reporting intervals and visit rules. Agree the fields each source will provide and how any historical data will be included.
- Pilot representative stores. Include a typical entrance and any more complex location. Compare counts with an agreed manual observation period and reconcile imported sales against the POS.
- Validate the reports. Review dashboards, user permissions, scheduled reports and exports. Confirm that each metric uses consistent definitions across locations.
- Roll out and review. Agree the launch date, responsible owners and support contact. Monitor the first reporting cycles and use the findings to refine your team’s reporting routine.
Consistent measurement makes the numbers useful. Entrance crossings are not automatically unique shoppers: someone who leaves and returns may create another visit. If staff exclusion or counting boundaries change, annotate the date and explain the effect on the conversion denominator.
Build reporting around the way your team works
BoostBI visitor dashboards typically refresh every 10 minutes, with updates as frequent as one minute when real-time mode is enabled. POS imports have their own timing, and AI Sales Coach guidance is weekly. Match each report to its decision: a current traffic check, yesterday’s store review or next week’s staffing discussion.

Configure access so store teams see the locations they manage and regional teams can compare their estate. During the demonstration, request a sample report, its available export format and the delivery schedule. Confirm the fields, date range and permissions you need so the reporting setup fits your team’s workflow.
Use a repeatable review: check data completeness, compare visits with transactions, identify unusual periods and assign an action. The retail productivity scorecard provides a useful companion for connecting traffic, sales and staffing.
What to include in your V-Count assessment request
Send your number of stores and entrances, sensor models, site photographs, POS details, sample data, required historical period and priority reports. Ask the proposal to identify hardware, software billing units, selected features, API scope, installation, integration work, training and support. Use the current V-Count pricing page as a starting point and confirm the actual deployment assumptions in your quote.
Plan your next step with V-Count
Bring your store requirements and existing counter data to a BoostBI demonstration. V-Count can assess the connection route and show how visitor reporting fits your stores and decisions.
Frequently asked questions
How does V-Count integrate visitor analytics with POS, loyalty and inventory systems?
V-Count connects visitor insights with compatible business data through BoostBI’s available POS integrations and a scoped REST API route. Shopify and Nebim are listed as native integrations. For loyalty or inventory projects, ask V-Count to assess the required fields, permissions and data direction with your system provider. This gives your team a practical integration plan without assuming that every application has a ready-made connector.
Can I integrate my existing people counter and POS system with BoostBI?
V-Count can assess both sides of the connection: the counter’s model and available data, and the POS system’s version and transaction export. Where those inputs are compatible, BoostBI can put visits alongside sales and conversion. Send V-Count a sample feed and store list so the proposed solution identifies which equipment can stay and what connection work is needed.
How quickly can V-Count BoostBI show visitor analytics?
V-Count BoostBI typically refreshes visitor dashboards every 10 minutes, with updates as frequent as one minute when real-time mode is enabled. Confirm that configuration for your deployment and check POS import timing separately. V-Count’s AI Sales Coach adds weekly guidance, giving teams a complementary review of performance rather than a live alert feed.
Which V-Count tools collect and analyze retail footfall?
V-Count pairs people counting hardware with BoostBI visitor analytics. Nano AI is a current option for entrance counting; Nano Prime supports projects that require heatmaps with suitable coverage and mapped zones. V-Count helps match the sensors, placement and selected software features to the decisions you want to make, from comparing busy hours to examining store conversion.
Which visitor analytics features should a small retailer look for?
Start with dependable entrance counts, useful daily and hourly reports, compatible POS data, clear access permissions and a price tied to the agreed deployment. V-Count BoostBI brings visitor reporting, configurable dashboards and sales analysis into a platform that can serve a single store or a growing estate. Ask V-Count to demonstrate the reports and exports you will use before selecting additional capabilities.
How can V-Count help configure BoostBI for my stores?
V-Count can help match your BoostBI setup to the entrances, sensors, POS systems and reports your business needs. Share your store list, hardware details and priority decisions with the team. An agreed configuration and representative-store pilot help you build useful dashboards and give each manager access to the right locations.
Can BoostBI work with historical visitor and sales data?
Ask V-Count to assess your historical exports and available fields. Agree the date ranges, store identifiers, metrics and reporting intervals your project requires. A V-Count pilot using representative historical and current data helps your team validate meaningful comparisons before relying on them for store decisions.