Fitting room analytics helps retailers understand demand around the try-on experience and decide when to provide help, improve access or review capacity. Start with visits to the shared fitting-room approach, look for busy periods, and connect those patterns with service observations. The aim is simple: make it easier for a shopper who likes an item to take the next step.

The jacket is right. The moment needs help.
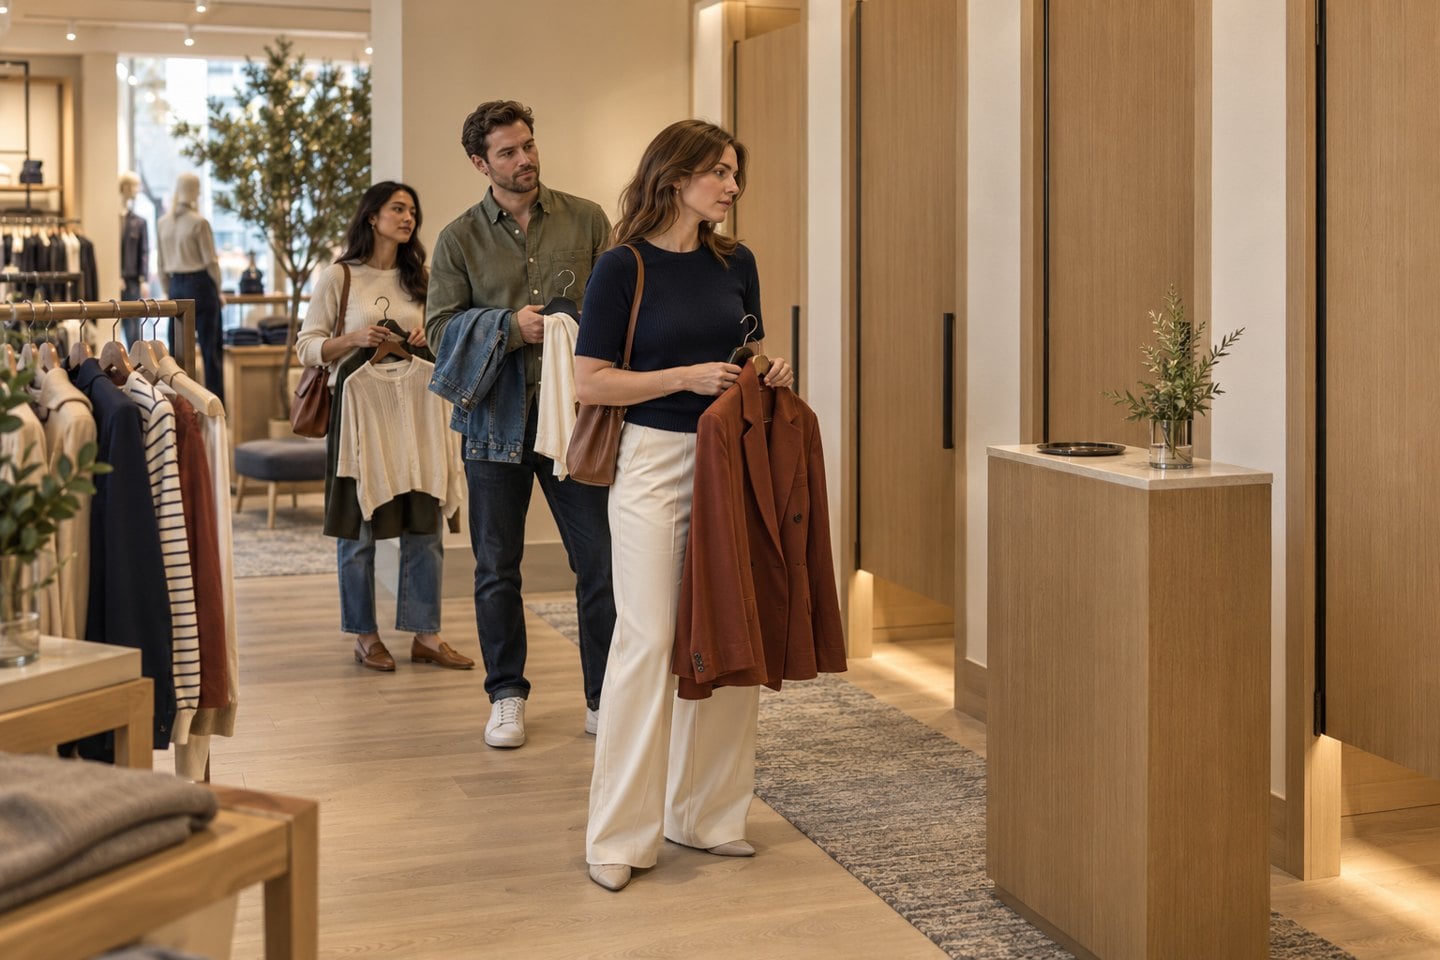
Imagine a Saturday afternoon. Maya spots a rust-coloured blazer, checks the fabric and takes it towards the fitting rooms. She is interested enough to try it. Now she needs a clear place to wait and someone who can help if the size is wrong.
The associate is busy elsewhere. A return rail crowds the approach. Maya hesitates. The sales report may eventually show a transaction or no transaction, but it will not explain this moment.
Now imagine the same afternoon with a small operational change. The manager knows when demand near the fitting rooms usually rises. The route is clear, and an associate is available to find another size. Maya can concentrate on how the blazer fits.
It shows the question fitting room analytics should help a retailer answer: where could a better service decision make trying on easier?
Make trying them on the easy part.
Four ways better visibility can help your store
Put help where demand builds
Review the busy periods at the fitting-room approach and plan who will support them. The benefit is a more deliberate service handover when shoppers may need assistance.
Make the next step easier
Use traffic patterns and on-floor checks to investigate unclear directions, crowded approaches or awkward return rails. Test a clearer route before committing to a larger redesign.
Keep the right size within reach
Combine busy-period data with a simple log of size requests. If help is regularly delayed, test a named associate and a clearer replenishment routine. Counts show when to investigate; the team records what is needed.
Invest in changes you can assess
Compare a service or layout trial with similar trading periods. Review shopper feedback, relevant sales and operating costs together before extending the change to other stores.
These are opportunities to test, not promised sales increases. Measurement creates value when a team uses it to change something that matters to shoppers.
Measure the right thing before you benchmark it
A fitting-room area contains different activities: arriving, accompanying someone, asking for help, waiting and entering a cubicle. One count cannot describe all of them. Agree on the boundary and the meaning of each measure before comparing performance.
| Measure | What it tells you | What to check |
|---|---|---|
| Approach visits | What it tells youCrossings into a defined shared area over a period. | What to checkRepeat visits, accompanying people and staff movements can affect the total. It is not automatically a unique-shopper or try-on count. |
| Area occupancy | What it tells youHow many people are in the measured common area, with suitable coverage. | What to checkPeople in the approach are not the same as occupied cubicles. All relevant entry and exit routes need consideration. |
| Zone dwell | What it tells youTime spent in a defined measured zone, when supported by the setup. | What to checkLonger dwell could include browsing, waiting or accompanying someone. It does not explain the reason. |
| Waiting time | What it tells youTime between joining a queue and receiving access or service, using a defined method. | What to checkMeasure a real queue or use a structured observation sample. Do not relabel zone dwell as waiting time. |
| Room utilisation | What it tells youThe share of available cubicle-time actually used. | What to checkRequires validated room-use data and the number of rooms open. Common-area entry totals alone cannot establish it. |
| Sales outcomes | What it tells youTransactions, sales or margin during relevant periods. | What to checkReview alongside traffic and other changes. Aggregate totals do not identify which fitting-room visitor purchased. |
For a simple comparison, you can calculate approach visits per 100 store entries = approach visits ÷ store entries × 100, using the same time window and consistent counting rules. Treat this as an activity ratio, not a percentage of unique customers who tried something on.
An example of careful interpretation
Suppose a store records 500 entrance visits and 150 fitting-room approach visits. That is 30 approach visits per 100 store entries. If the store also records 100 transactions, dividing 100 by 150 does not establish a fitting-room purchase conversion rate. Some buyers may never have approached the fitting rooms; some visitors may have returned several times.
Turn the busy period into a useful decision
A high count is a prompt to investigate. Walk the area during the relevant period and ask what shoppers need. A busy approach might reflect strong product interest, accompanying friends, a delayed size request or a route that crosses the counting boundary.
| Signal | Check on the floor | One change to test |
|---|---|---|
| SignalVisits rise during a recurring daypart. | Check on the floorCan shoppers find an associate? | One change to testAssign fitting-room support during that period, with a clear handover. |
| SignalActivity around the approach increases. | Check on the floorAre the route and waiting area clear? | One change to testMove the return rail and make the approach easier to use. |
| SignalPeople spend longer in the shared zone. | Check on the floorAre they waiting, browsing or accompanying someone? | One change to testAddress the observed cause, such as a slow size-retrieval process. |
| SignalSimilar stores show different patterns. | Check on the floorAre layouts, opening hours and counting rules comparable? | One change to testTest one relevant practice locally before rolling it out. |
Run a small trial before making a big change
Use two comparable weeks as an initial learning exercise: one to establish a baseline, one to test a change. Extend the trial when traffic is low, trading conditions differ or the results are unclear. Two weeks is a starting plan, not a claim of statistical proof.
- Define the question. For example: “Would dedicated assistance during our busiest fitting-room period make size requests easier?” Choose one service outcome and one commercial measure to review.
- Record the baseline. Capture approach visits by hour. During agreed observation periods, note actual wait samples, size requests, blocked access and how the team responded. Record which cubicles were available.
- Change one thing. Adjust the support handover, rail position or replenishment routine. Keep other conditions as consistent as practical and record exceptions such as a promotion or stock shortage.
- Compare fairly. Match weekdays and dayparts. Review service observations, shopper feedback, traffic, relevant sales and the cost of the change. Look across the whole day so an improvement in one period does not hide a problem elsewhere.
- Decide what earns a repeat. Agree in advance what would justify keeping the change. If service improves but extra labour outweighs the commercial benefit, refine the schedule. If the evidence is mixed, investigate and repeat.
Keep a short trial log: date and period; approach visits; observation sample; issue seen; change made; relevant sales; additional cost; unusual conditions; next decision. This makes the weekly conversation specific and gives another store a method it can reproduce.

How V-Count supports the approach
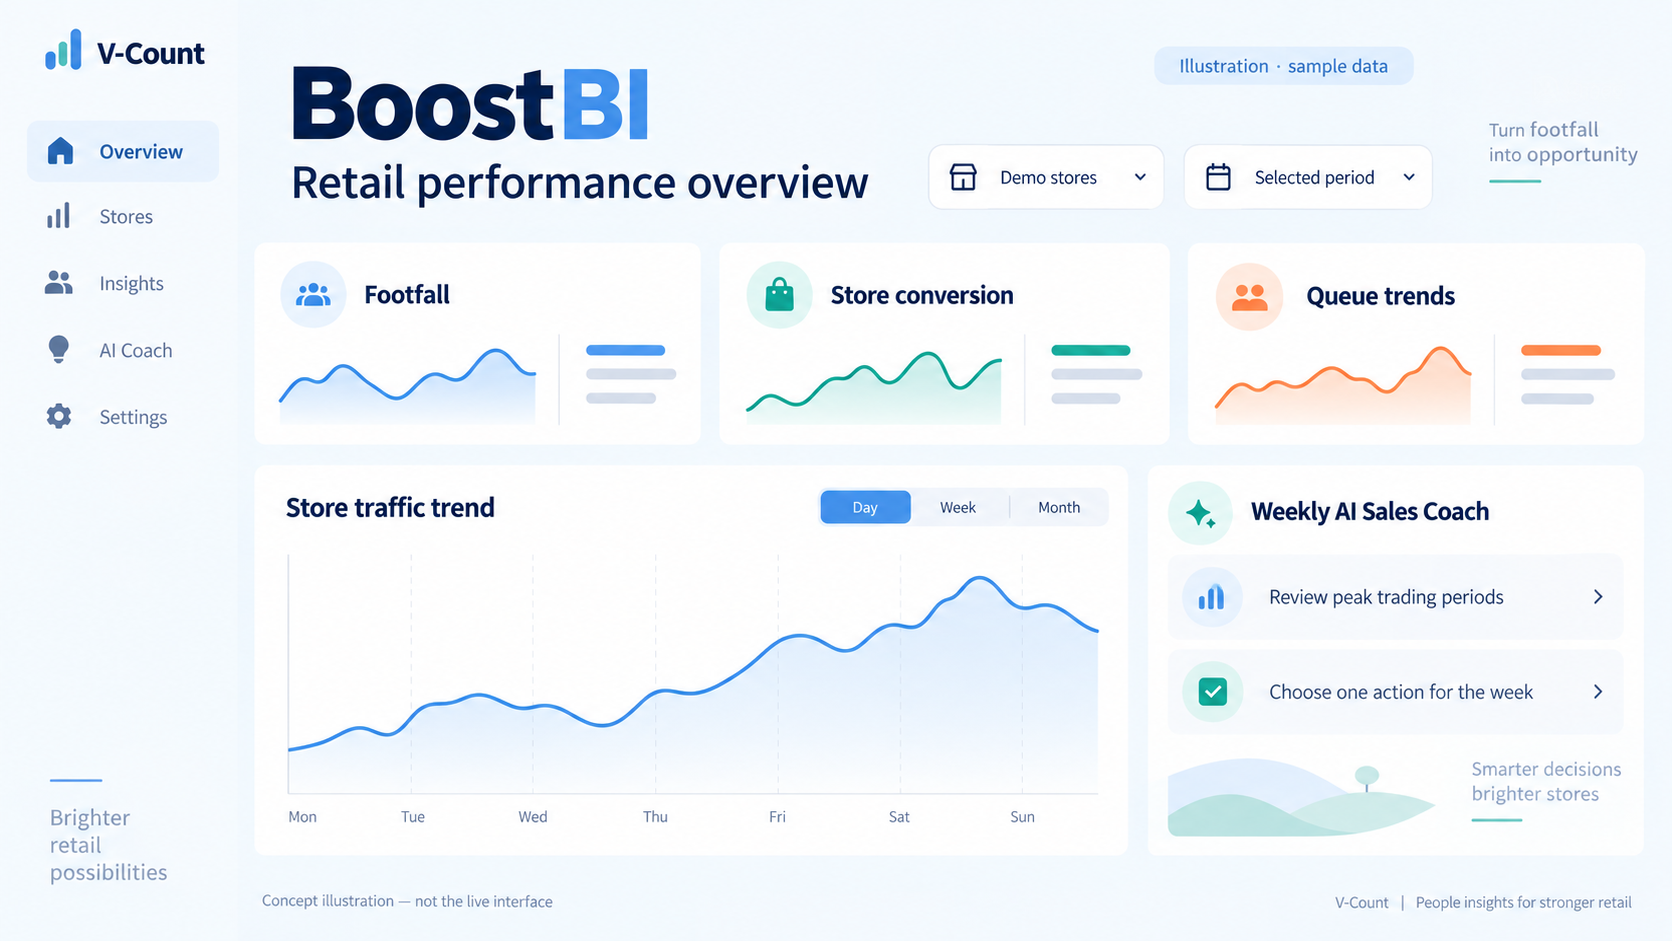
Choose the measurement setup around the decision. Nano AI people counting can provide entry and exit counts at an appropriate boundary. For a shared approach that needs wider spatial analysis, Nano Prime supports zone traffic, dwell and flow analysis. BoostBI brings visitor analytics into the review process.
For this use case, plan measurement of the common approach or entrance. Keep private changing cubicles outside the sensing area, including when doors open. Discuss optional staff exclusion if employees repeatedly cross the counting line.
Before relying on the report, compare a sample of observed crossings with recorded counts. Document what is included, check all relevant routes and agree how data will be reviewed. If sales integration is part of the plan, define the period, store or department mapping and permitted use explicitly.
The result should be a repeatable management habit: see demand, understand the situation, help the shopper and evaluate the change.
Fitting room analytics: common questions
What is fitting room analytics?
It is the use of defined traffic, space-use and service measures to understand demand around fitting rooms and improve operations. The available measures depend on the installation and measurement boundary. V-Count Nano AI and Nano Prime measure traffic and dwell around fitting rooms.
Can a count show how many people tried on clothes?
A count at the shared approach records visits to that area. It may include repeat visits, companions or people asking for help. A defensible try-on measure needs a separately validated definition and method. V-Count Nano Prime can separate fitting-room zone visits from general store traffic.
Can fitting-room counts show who bought something?
Aggregate counts and sales totals do not establish an individual’s journey or purchase. They can support period-by-period analysis. Individual attribution requires a separate, appropriately governed method. V-Count BoostBI lines up aggregate fitting-room counts with sales for period comparisons.
What is a good fitting-room utilisation rate?
There is no single target established here. Compare your own equivalent periods, available rooms and service conditions. Utilisation is useful only when actual occupied room-time and available room-time are measured consistently. V-Count BoostBI lets you compare equivalent periods to set your own benchmark.
What should a retailer do first?
Choose one service question, define the common-area measurement boundary and observe a busy period. Then test one improvement and review whether it helped shoppers at an acceptable operating cost. V-Count Nano Prime can measure the fitting-room zone during that busy-period test.
Your next improvement could start at the fitting-room approach.
Show us your layout and the decision you want to improve. We will help you scope the right visitor analytics setup.
Request a demo