Industry · Parks & Recreation
Park & Recreation Area People Counting
For park or recreation center operators measuring footfall, conversion, capacity, and staffing
V-Count’s Nano AI sensors count every visitor to your park or recreation center in 3D, anonymously — no video-based recording, no faces, no personal data. BoostBI turns those counts into footfall by hour, capture rate, dwell time, zone heatmaps, live occupancy alerts and conversion, so staffing, layout and marketing decisions rest on measured evidence instead of estimates.
Join the Ranks of Our Prestigious Clients
Explore the gallery showcasing our diverse range of customers. We’re proud to work with these leading brands, providing visitor analytics solutions that drive their success.












Benefits of Visitor Analytics for Parks & Recreation
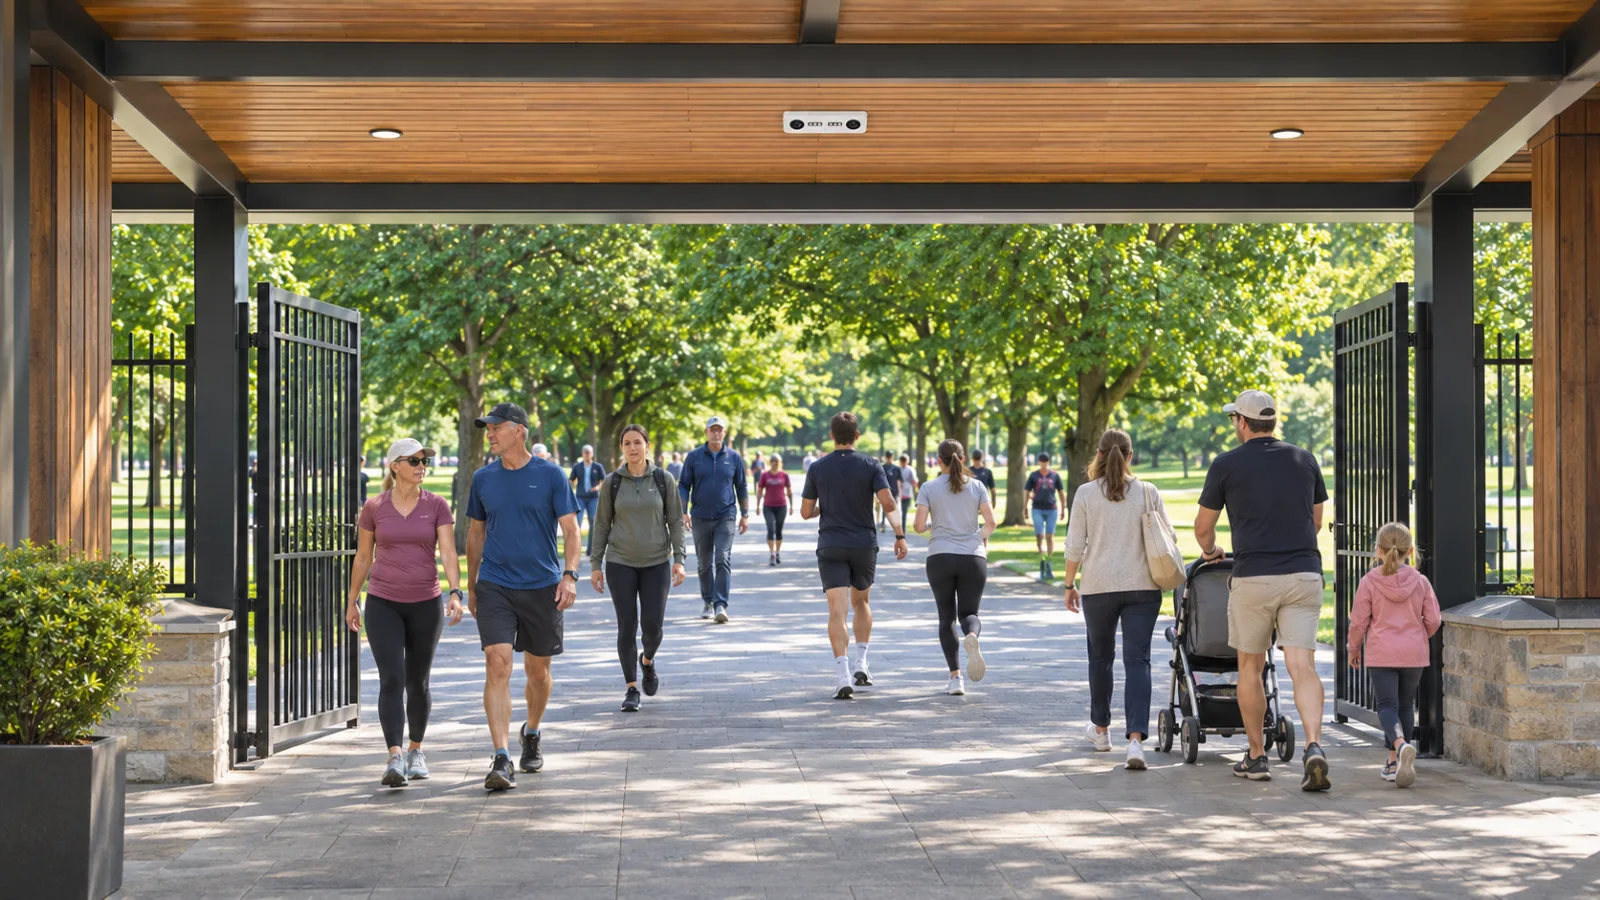
For parks and recreation centers, people counting and visitor analytics bring a clear advantage in staff allocation. Real-time usage data shows when the visitor center, the café and the main facilities are at their busiest, so staff can be scheduled to the peak times your park actually has.
Tracking peak usage times also lets cleaning and maintenance follow real usage: the visitor center, playgrounds and public facilities can be serviced promptly after periods of high activity, and maintenance alerts can be triggered by usage thresholds.
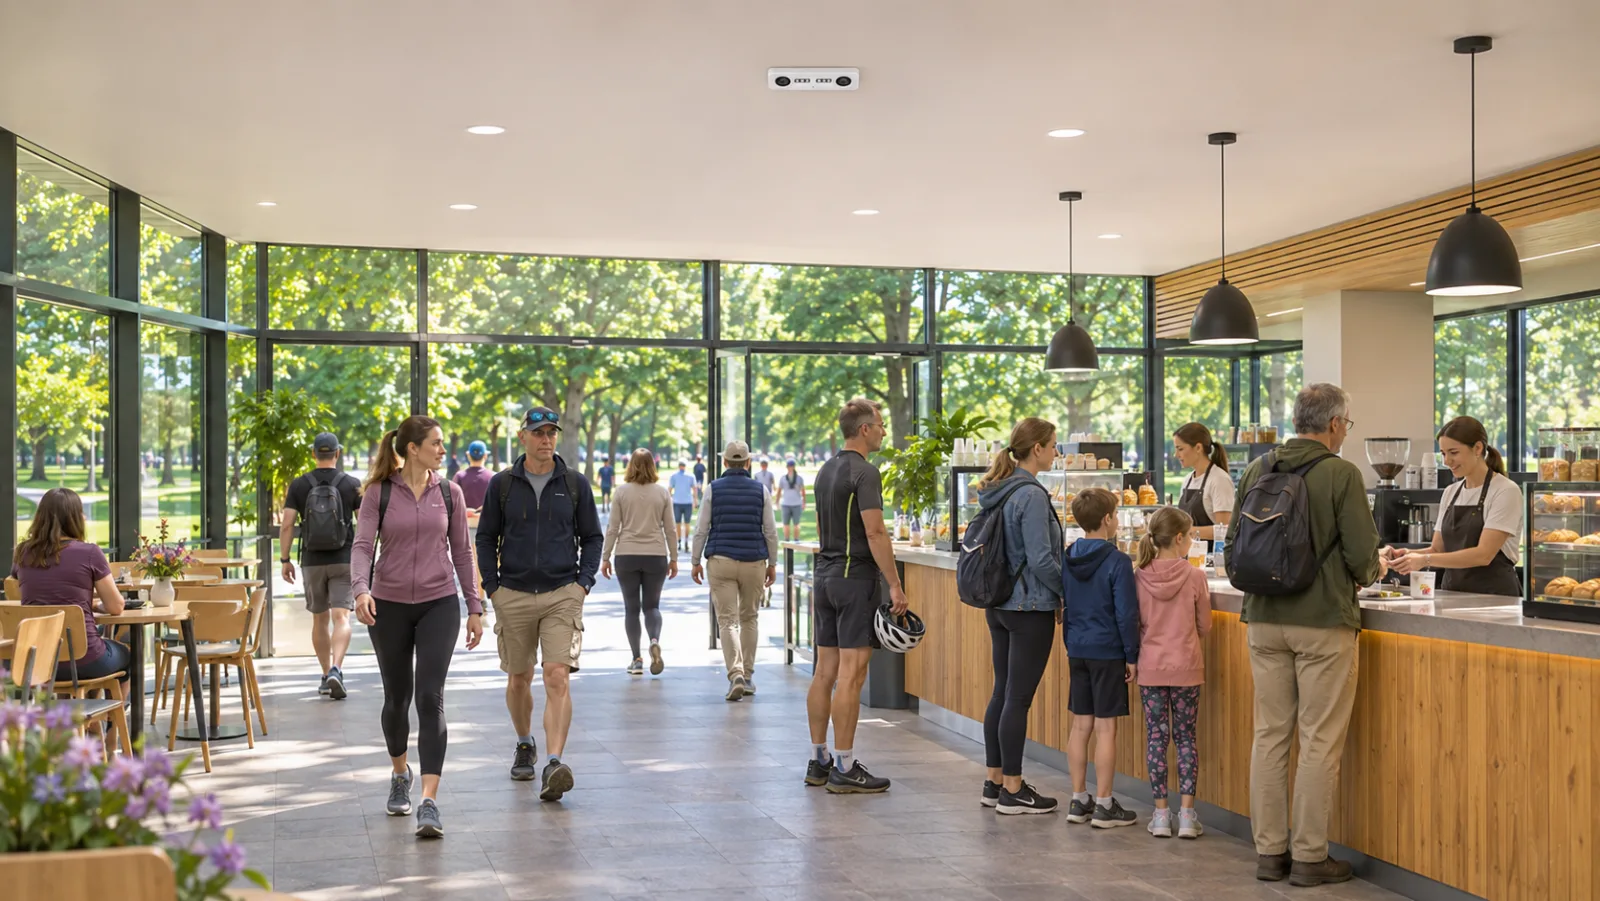
Queue management data shows how the line builds at the visitor center desk, the café and the facility entrances, so staff can be moved where they are needed before waits grow — reducing wait times and improving visitor satisfaction.
Over time, queue analytics reveal the hours and days when lines form, allowing targeted improvements in layout, staffing and resource allocation, so visitors spend less time waiting and more time enjoying the park.
Meet BoostBI
Visitor Analytics to Boost The Efficiency of Your Physical Locations
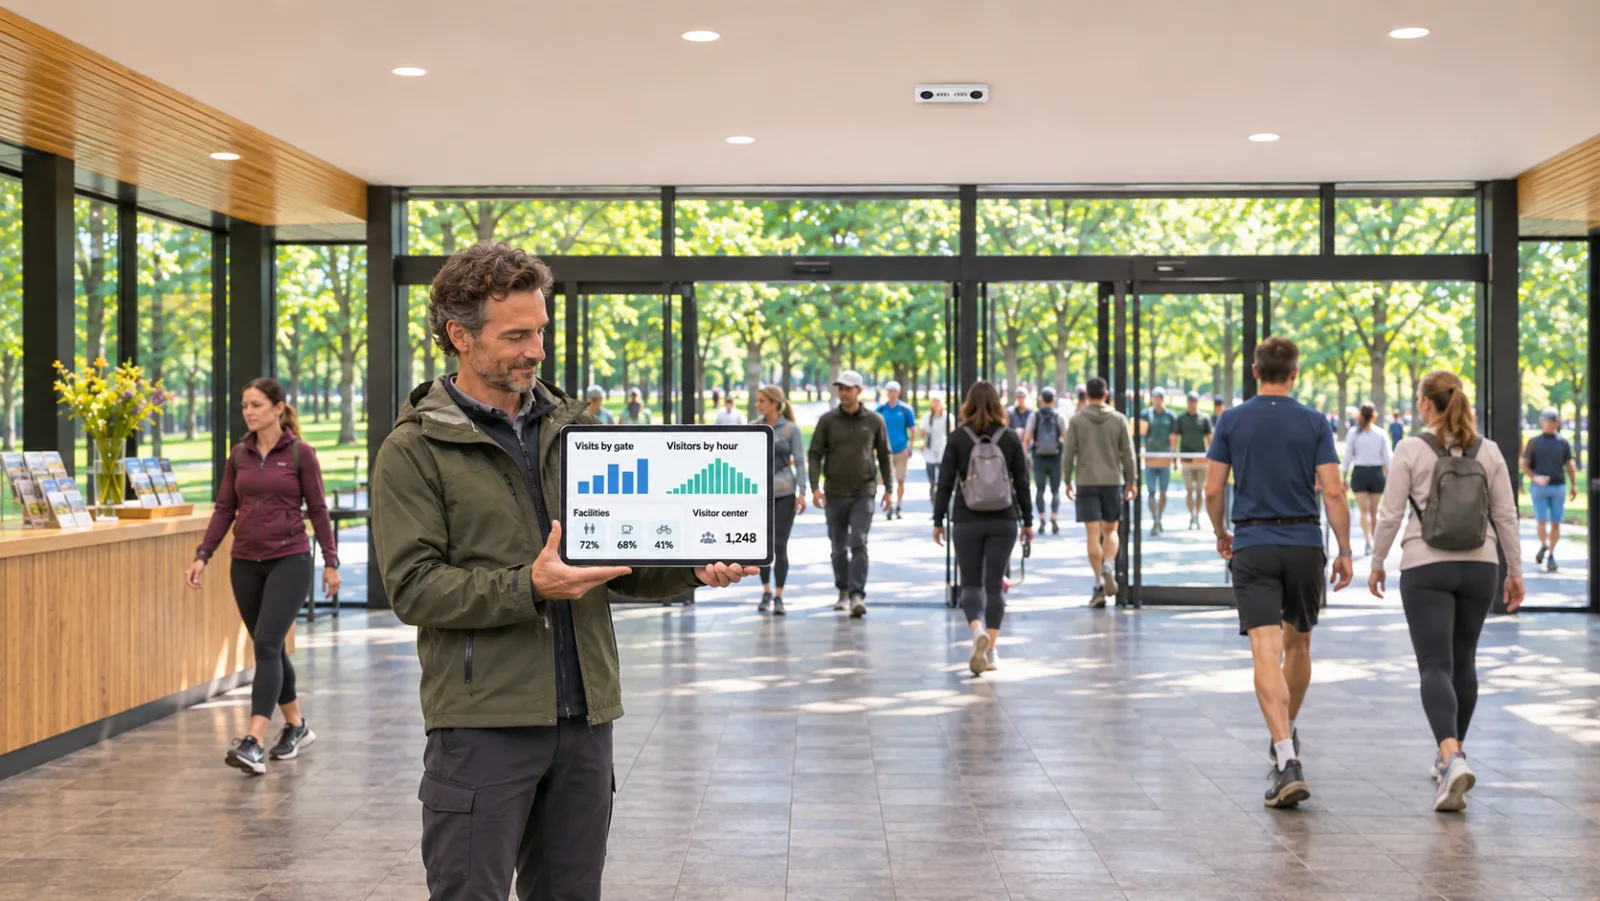
BoostBI turns the counts from your park and recreation area sites into visits by hour, live occupancy, dwell time and comparisons between locations, with reports and alerts on the web and in the mobile app.
Explore BoostBI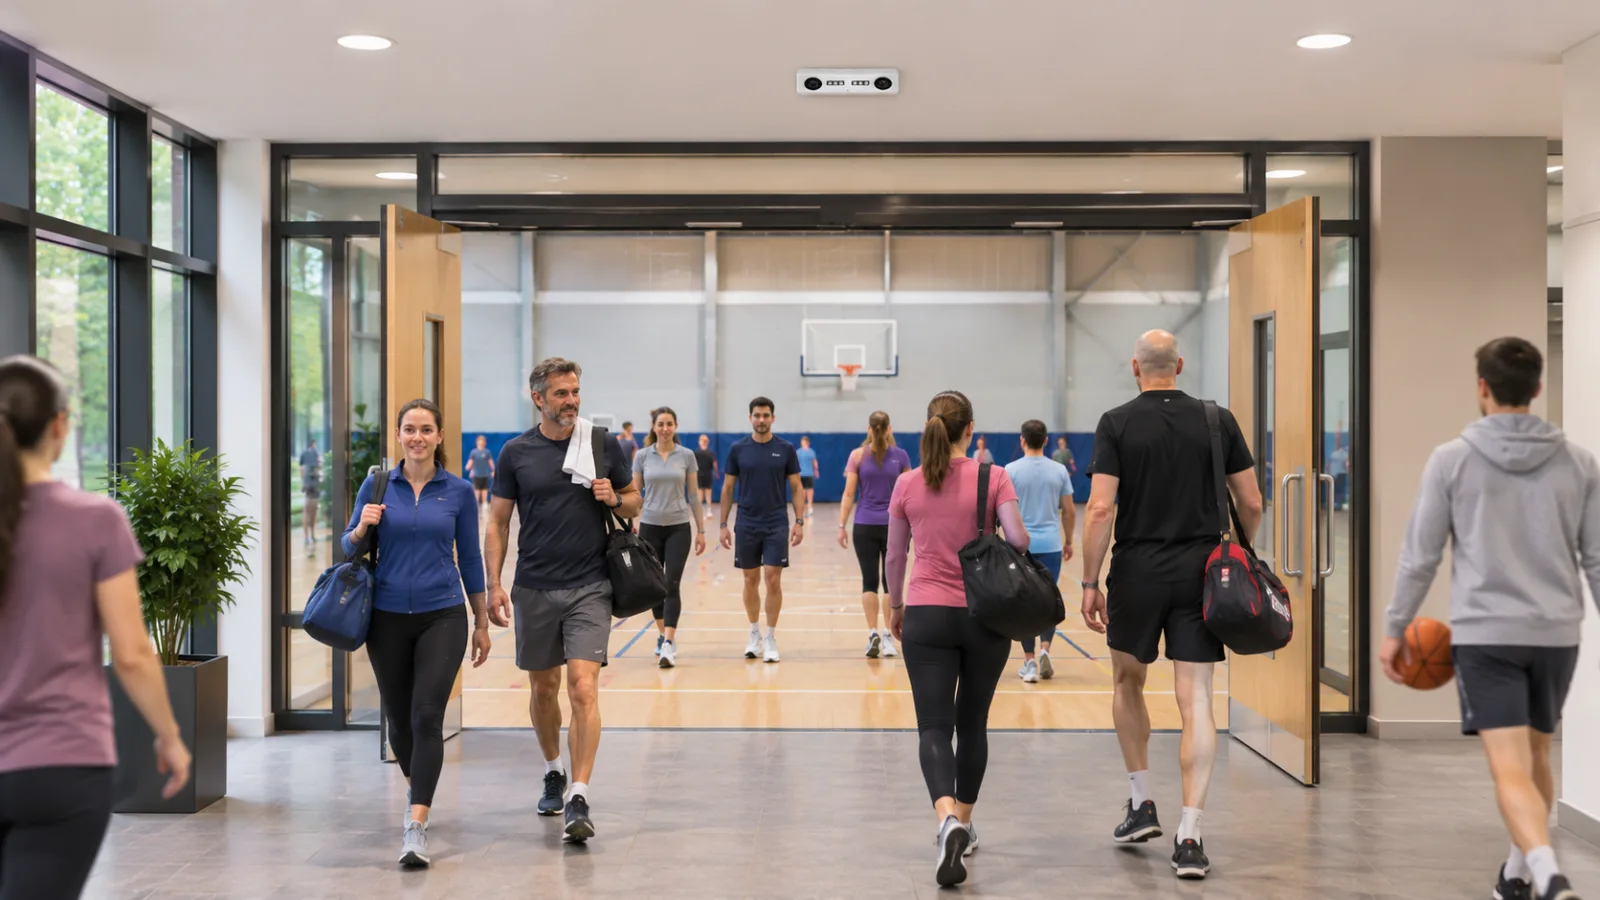
Sensors for Parks & Recreation
Nano AI counts people in and out at each entrance, Nano Outdoor covers open-air gates and entrances, and Nano Prime measures zones and dwell time inside. All three report to BoostBI.
Frequently Asked Questions
Everything you need to know about growing traffic, sales and efficiency with V-Count.
Request a demo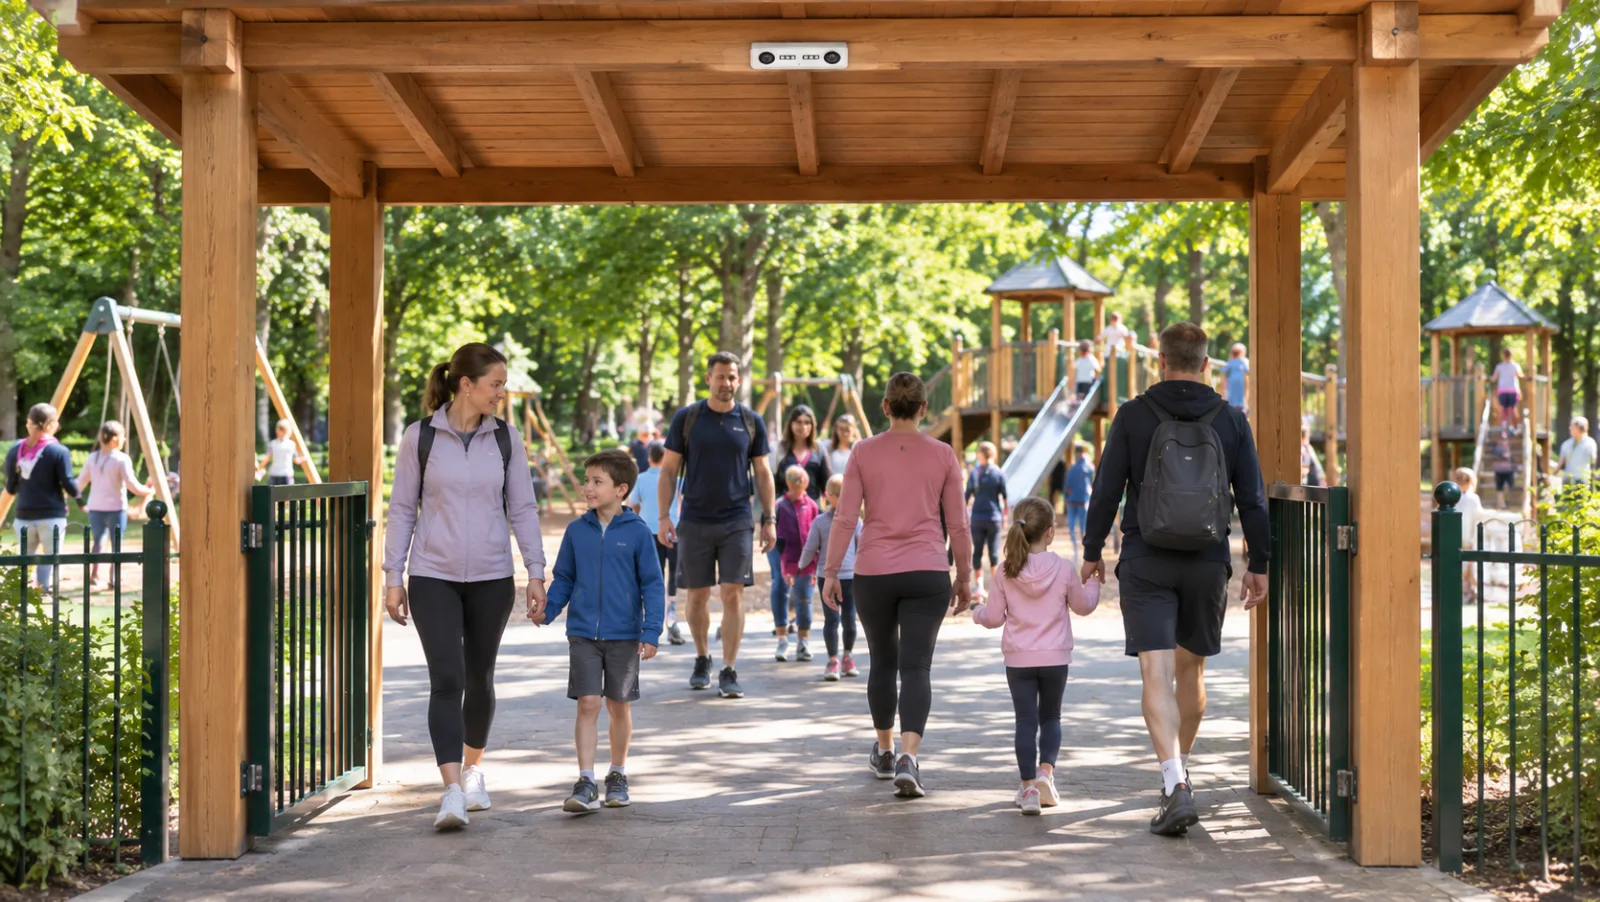
How do we count visitors to a park with multiple unstaffed entrances?
Nano Outdoor covers each gate, path entry or car park access point and aggregates in BoostBI, which gives a park-wide figure without putting staff on gates.
How do we justify maintenance, grounds and ranger budgets?
Counted visits from V-Count sensors by hour, day and season give a defensible usage figure per site, which is a measured basis for allocating maintenance and for defending a site at budget time. V-Count Nano Outdoor provides these counts at open-air sites.
Can we measure individual facilities such as playgrounds, courts and cafes?
Yes, V-Count sensors at each facility entrance report playgrounds, courts and cafes separately. Zones report visits and dwell per facility, so a splash pad or a court can be assessed separately from overall park traffic. V-Count Nano Outdoor and Nano Prime report visits per facility.
Will the sensors cope with weather and seasonal extremes?
Nano Outdoor is built for weather-exposed positions, which is the correct specification for gates, paths and open recreation areas.
How do we separate a weather effect from a real change in usage?
Compare like-for-like conditions across years in BoostBI rather than raw monthly totals, which is the only way a seasonal site can read a trend honestly.
How do we report usage to a municipality or funding body?
BoostBI exports visits by site and period, so a funding return or committee report can quote measured numbers with a consistent method across sites.
Does counting in a public park create a surveillance obligation?
No. No images are stored and no personal data is held, so counting does not create a surveillance obligation. V-Count sensors count anonymously and store no images.
Let’s turn insights into income together!
- increase visitor satisfaction
- optimize staff allocation
- decrease operational costs
- increase sales conversion
- get more foot traffic
- achieve more funds
- optimize product placement
- lower energy consumption
- create fascinating storefronts
- lower queue abandonment
- optimize store layouts