You got shoppers through the door. Now the real question: where do they actually go?
Entrance traffic tells you how many people came in. It says nothing about what happened next — and that’s where most of your revenue is won or lost. Two stores can have identical footfall and very different sales. The difference usually lives inside the journey: which zones shoppers visit, how long they linger, which products pull attention, and which areas they skip entirely.
Why entrance counts aren’t enough
Footfall is the start of the story, not the end of it. If you only measure entries, you’re optimizing blind to everything that happens after the door. You can’t tell whether a flat sales week was a traffic problem or a layout problem. You can’t see that your best-margin category sits in a corner nobody walks to. And you can’t prove whether a new merchandising idea actually changed behavior — or just felt like it did.
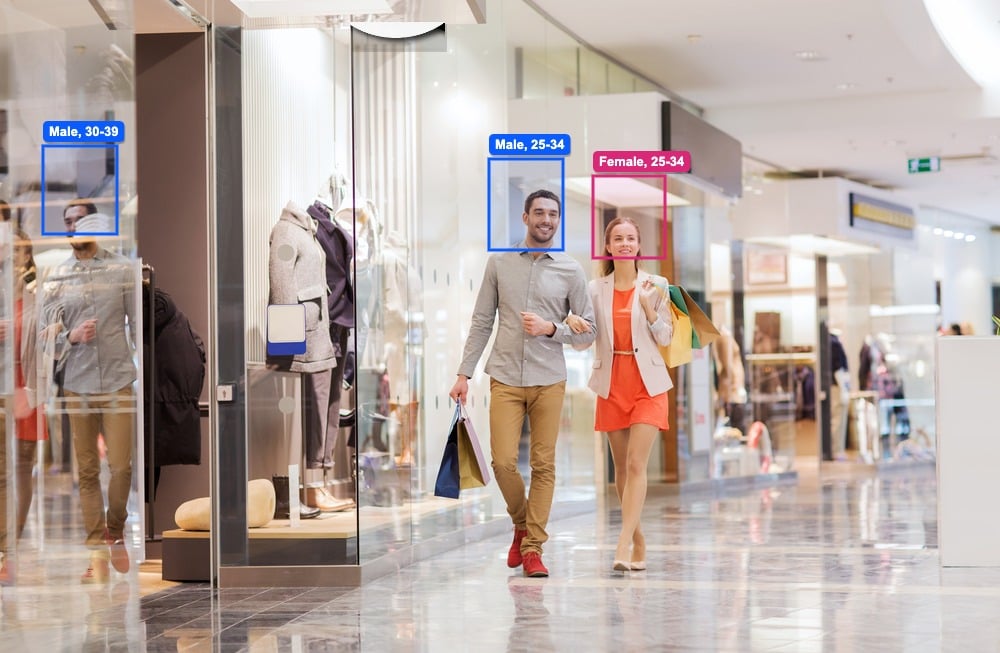
In-store analytics closes that gap. By measuring movement, dwell and attention across the floor, you replace opinion with evidence.
What zone analytics and heatmaps reveal
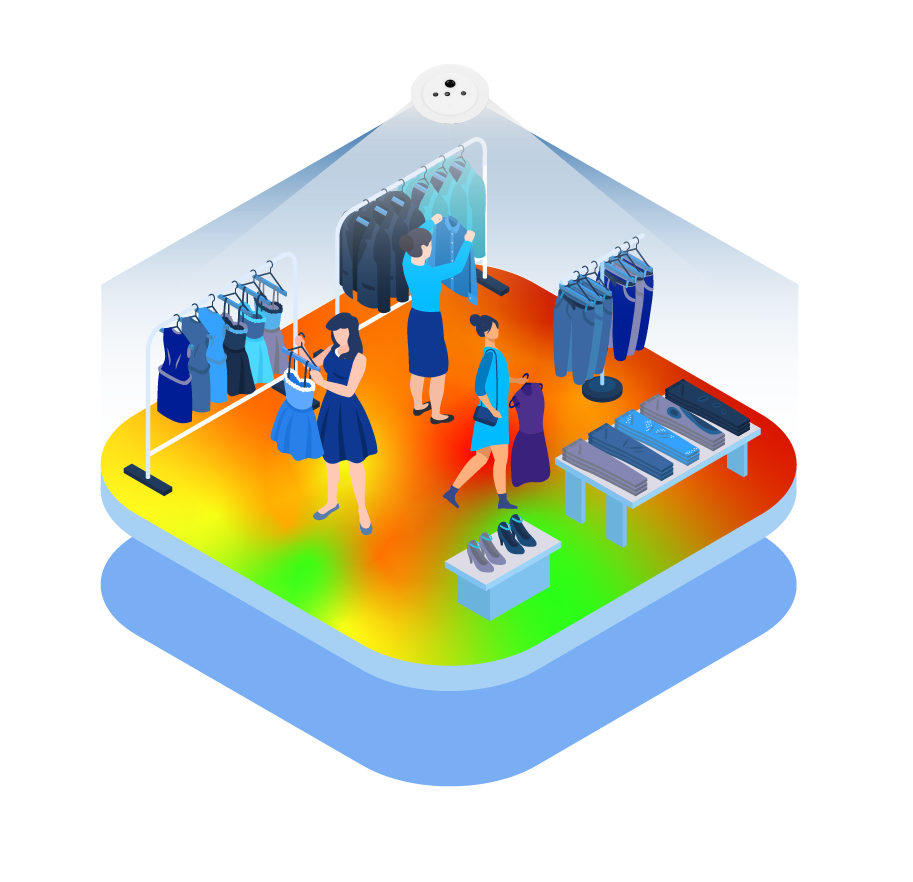
A store heatmap turns anonymous movement into a clear visual map of behavior:
- Hot zones — the areas that consistently attract and hold attention, so you know where to place high-margin products.
- Dead zones — the floor space shoppers ignore, which you’re paying rent and energy on without return.
- Dwell time by area — how long people actually engage with a display, category or feature.
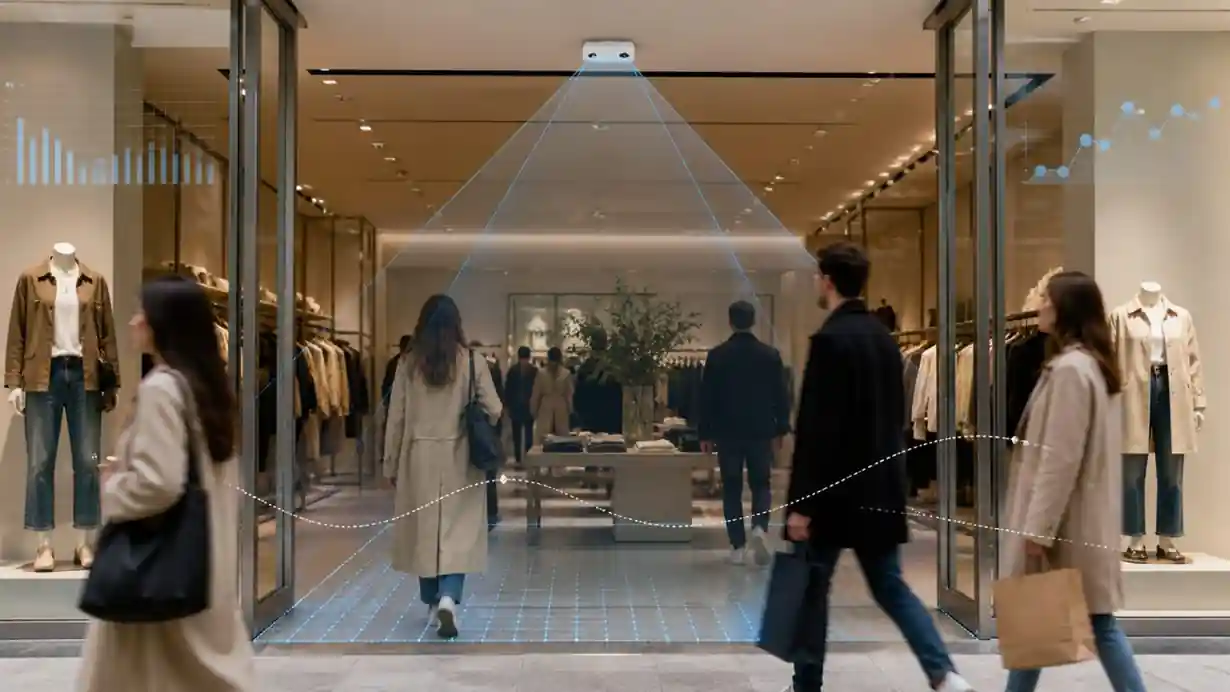
- Visitor flow — the paths shoppers take, revealing natural routes and bottlenecks.
- Product attraction — which displays draw people in versus which get walked past.
With this picture, layout, product placement, staffing and merchandising stop being guesswork.
From insight to action
- Move high-margin products into proven hot zones instead of hoping a corner display gets noticed.
- Fix or repurpose dead zones — re-merchandise, add a feature, or reclaim the space.
- Run faster test-and-learn cycles. Change a layout, measure before and after, keep what works, and roll it out.
- Staff to behavior, positioning people where shoppers actually spend time and need help converting.
What good looks like
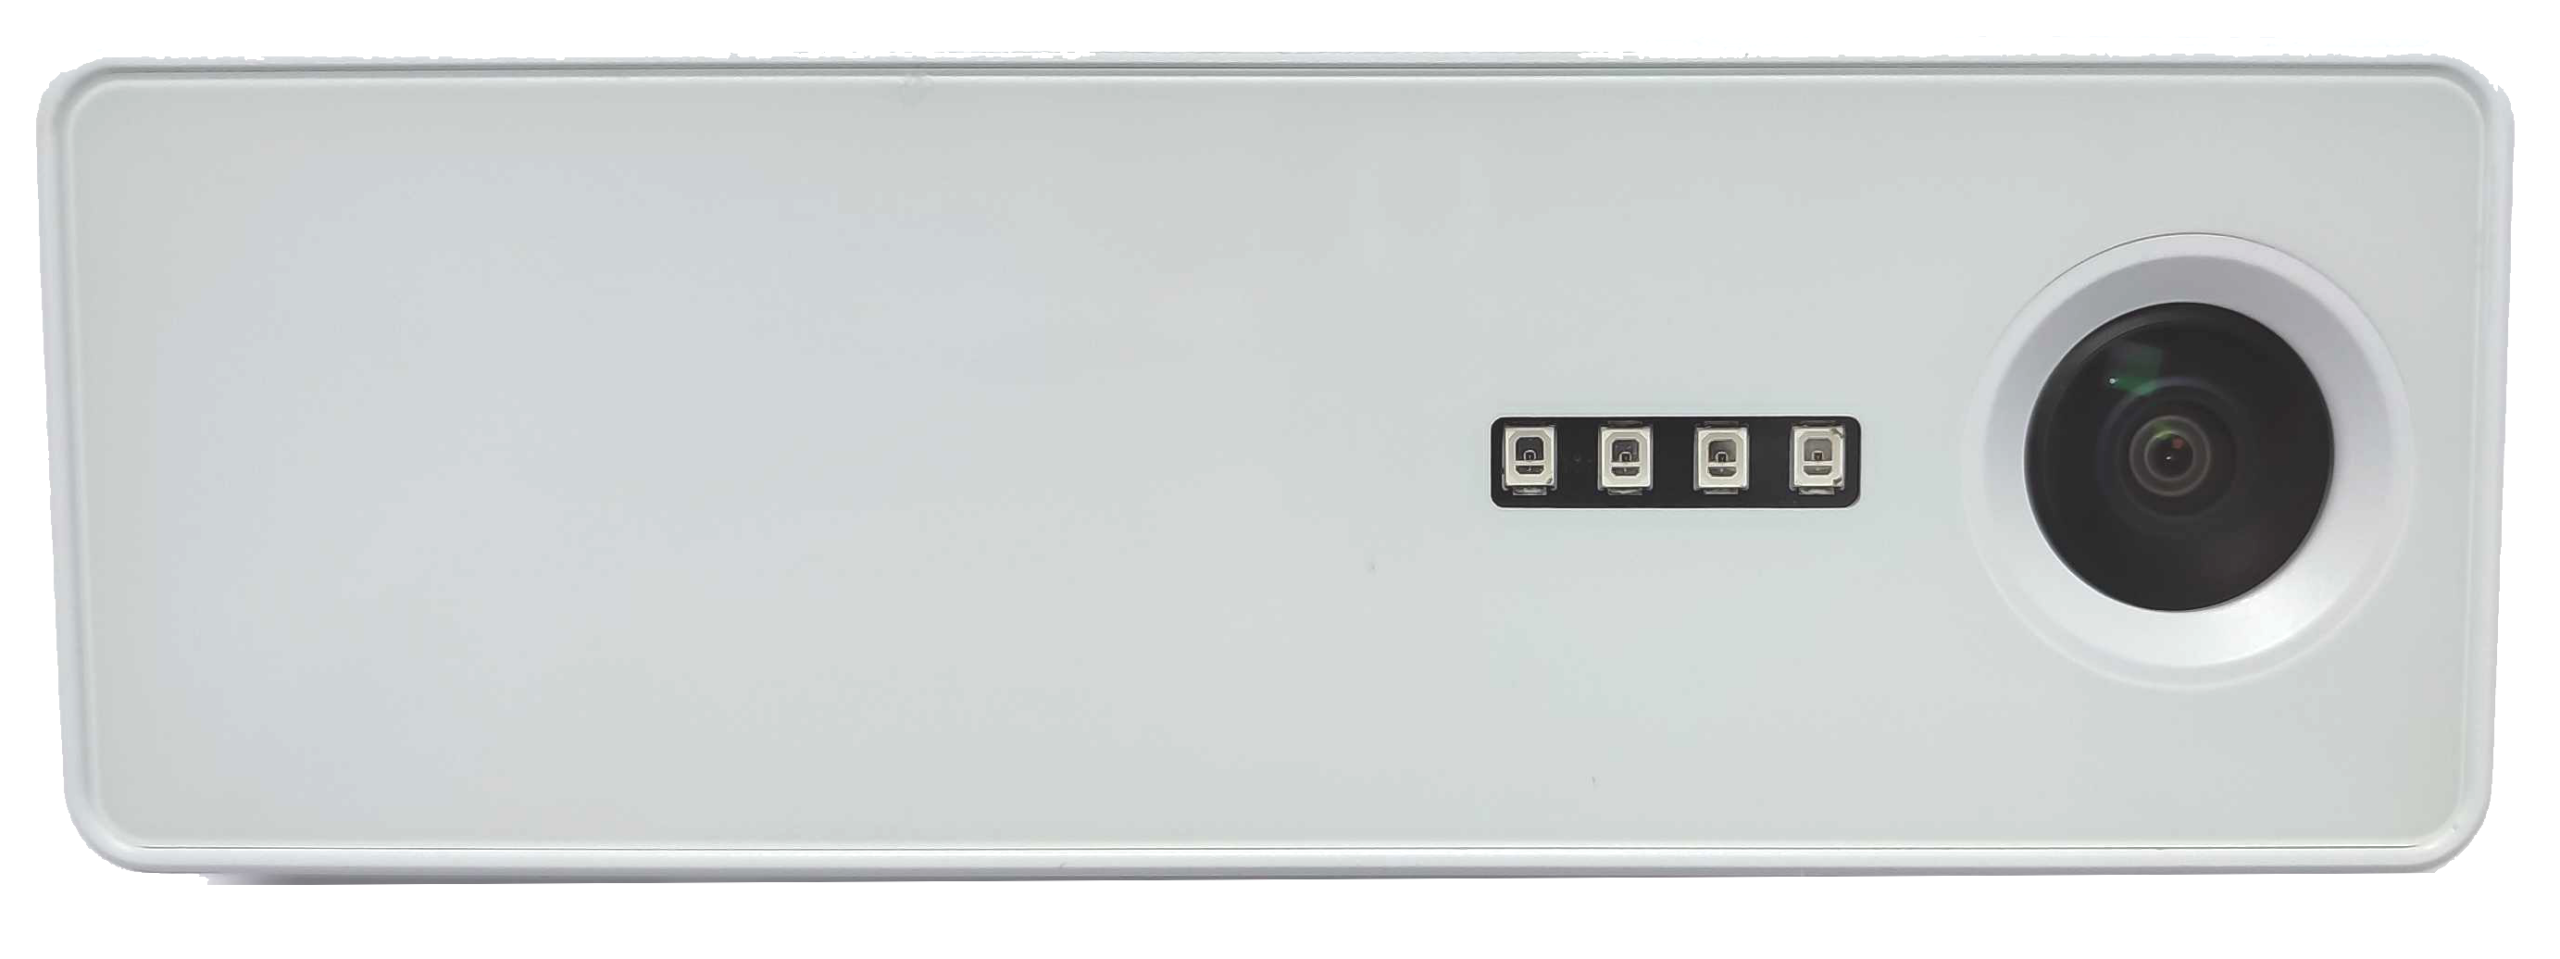
V-Count’s Nano Prime is built for exactly this gap — understanding movement inside the store, not just at the door. In Nano Prime retail programs, teams have highlighted results such as roughly +12% average conversion uplift and a target of -40% dead-zone reduction once layouts are measured and improved, with test-and-learn cycles running about 3x faster. (Results vary by location, layout, traffic and execution.)
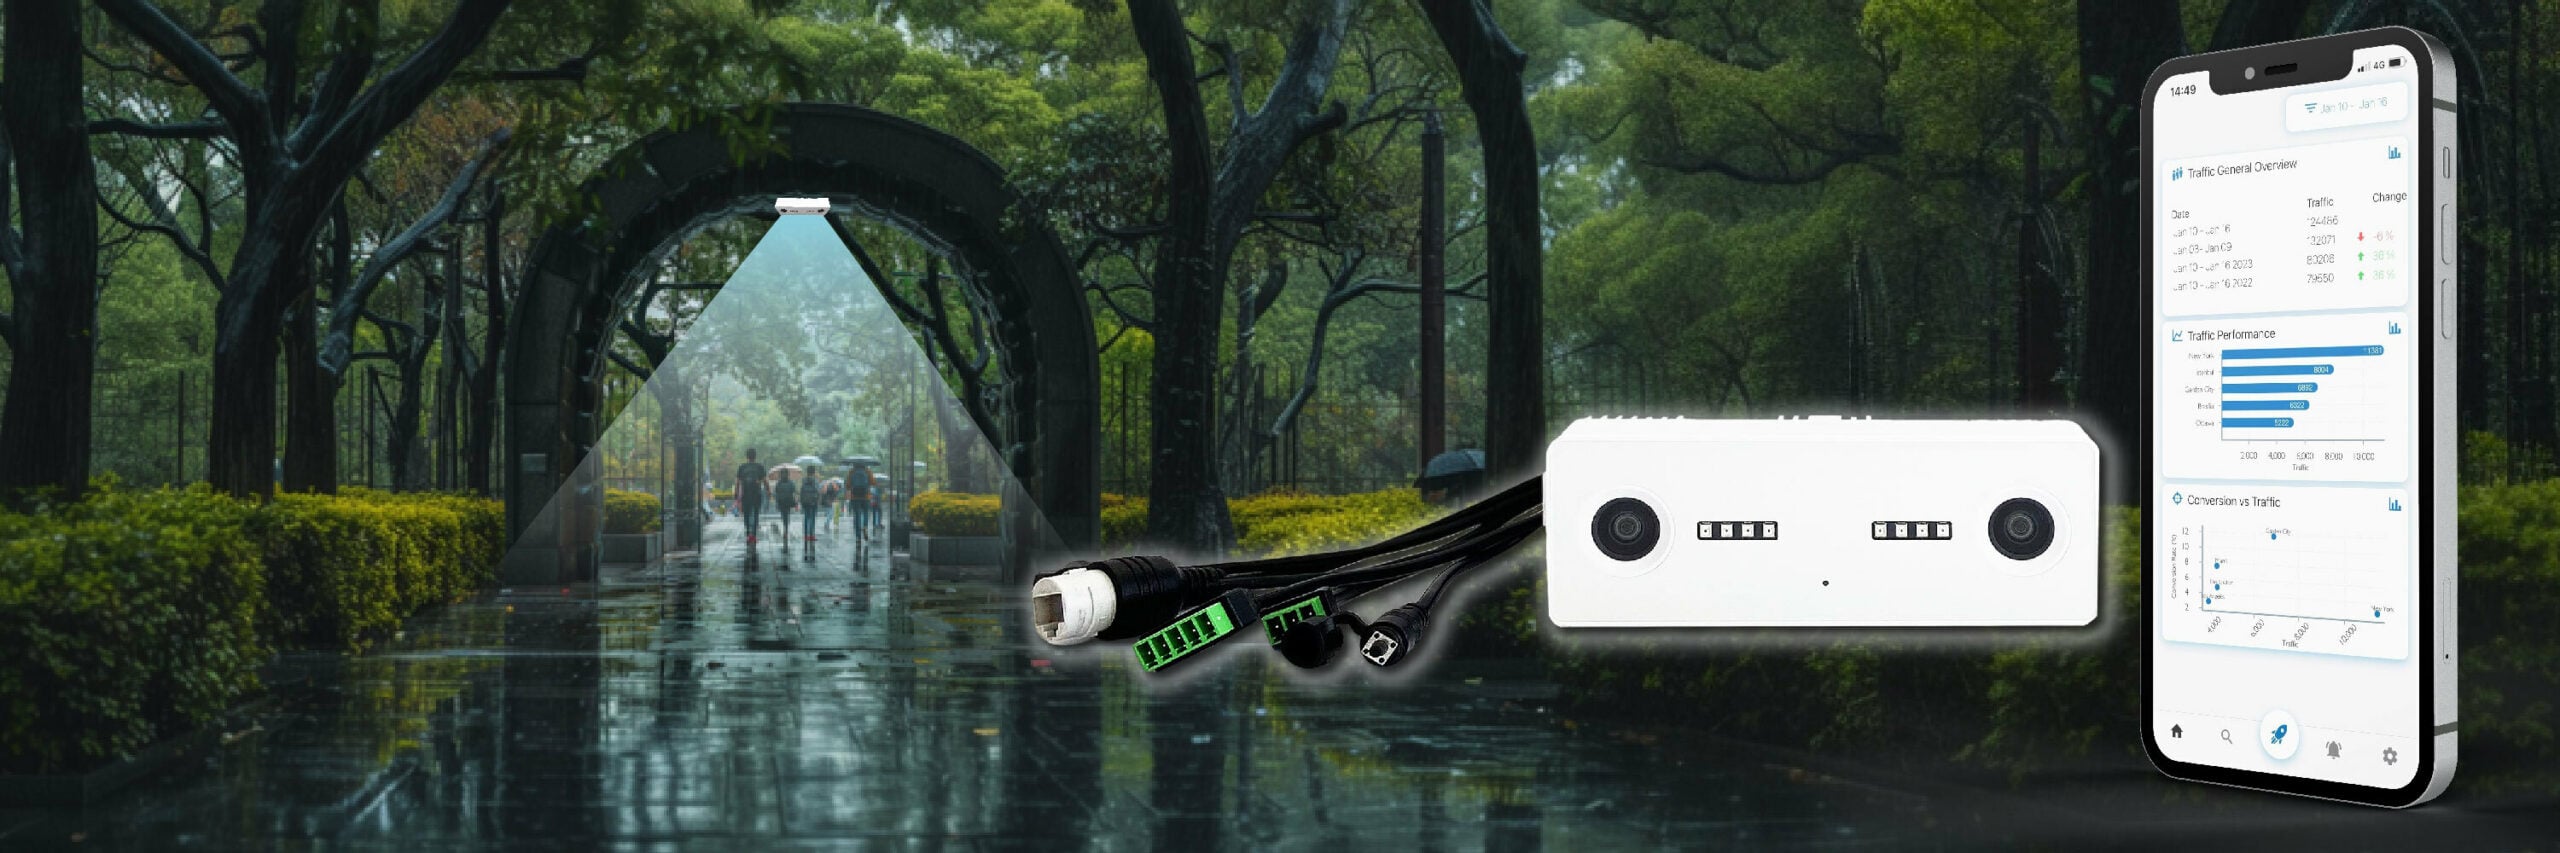
Underpinning it all is counting you can trust: V-Count’s 3D AI sensors deliver up to 99% people-counting accuracy, process data anonymously on the device, and store no personal images — so your zone analytics are reliable and privacy-compliant (GDPR/CCPA).
The takeaway
You’ve already paid to get shoppers into the store. Zone analytics and heatmaps help you earn more from that existing traffic by showing you what shoppers really do — then scaling the experience that converts.
Percentage figures reflect V-Count campaign benchmarks and program targets; actual results vary by location, layout, traffic and execution.