Foot traffic data · Two sources compared
Foot Traffic DataSensors vs location data.
Which answers your question?
Foot traffic data comes from two very different sources: sensors that count people at your own entrances, and mobile location data that estimates visits from a sample of devices.
Here is what each one measures, where it is strong and how to combine them.
Trusted by leading brands
across 130+ countries
01 / Two sources
Counted at the door,
or modelled from phones.
Both are called foot traffic data. They are built in completely different ways.
On-site sensors
A people counting sensor is mounted above each entrance. V-Count Nano AI uses 3D active stereo vision and on-device AI to count entries and exits as they happen, with up to 99% accuracy under suitable conditions.
Counts go to BoostBI by hour and entrance, ready to combine with POS sales and staffing.
Mobile location data
Location analytics providers, such as Placer.ai, collect location signals from a panel of mobile devices, assign them to mapped places and extrapolate to estimate total visits.
Because the data is modelled, it can cover places where you have no hardware, including competitors and whole trade areas.
02 / Side by side
Sensors vs location data.
How the two sources differ on the questions buyers ask most.
| Factor | On-site sensors | Mobile location data |
|---|---|---|
| What is measured | Every crossing of a configured line at your entrance | Estimated visits based on a sample of mobile devices |
| Coverage | Only locations where sensors are installed | Any mapped place, including competitors |
| Accuracy | Counted directly; Nano AI up to 99%* under suitable conditions | Depends on panel size, location precision and the provider’s model |
| Detail | By entrance, direction and hour; occupancy from entries minus exits | Per place and period, as defined by the provider |
| Staff | Staff can be excluded (Nano AI: lanyard, shoulder tag or app) | Staff devices may be hard to separate from visitors |
| Best for | Conversion, staffing, occupancy, store comparison | Market share, trade areas, competitor and site-selection analysis |
| Cost model | Hardware per entrance plus software; Nano sensors US$299–799 per sensor (one-time), BoostBI US$9–49 per sensor per month | Subscription set by each provider |
*Sensor accuracy depends on entrance conditions, installation and calibration. Validate at your own doorway.
03 / Choose by question
Start with the decision
you need to make.
Why did sales change?
Use sensors. Conversion needs exact visits matched with POS transactions by store and hour.
How many staff do we need?
Use sensors. Hourly entries show when demand arrives at each store.
How many people are inside?
Use sensors at every public entrance: starting count plus entries minus exits.
How do we compare with competitors?
Use location data. Sensors cannot be installed in competitors’ stores.
Where should we open next?
Use location data to compare trade areas, then sensors once the store opens.
Do passers-by come in?
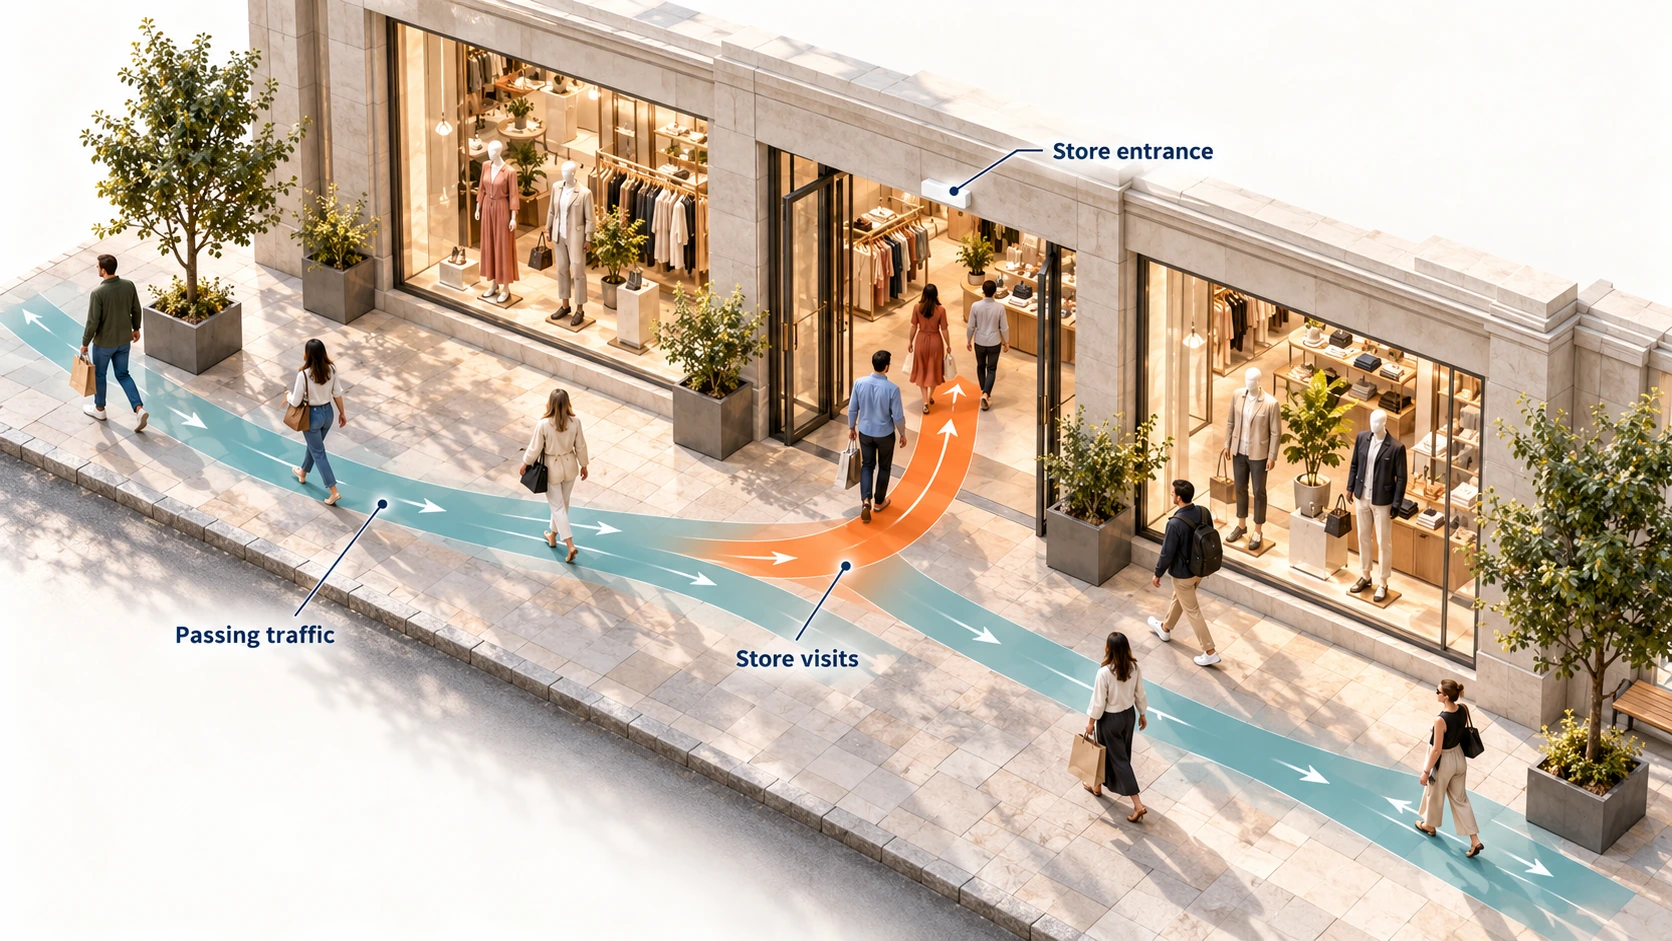
Use a storefront sensor such as Nano Outdoor to compare passers-by with entries: the capture rate.
04 / Use both
Exact counts in your stores.
Context from the market.
Sensors give you a reliable count of what happens at your own doors. Location data adds context from outside them.
- Use sensor counts as the source of truth for your own stores
- Use location data for competitor, trade-area and site questions
- Agree one definition of a visit before comparing the two
- Check trends against each other, not single-day totals

05 / Your questions, answered
Foot traffic data
FAQs.
Answers about sources, accuracy and which data fits your question.
Talk to an expertWhat is foot traffic data?
Foot traffic data describes how many people visit or pass a location over time. It comes from two main sources: on-site sensors that count people at entrances, and mobile location data that estimates visits from a sample of devices.
How is foot traffic data collected?
On-site, people counting sensors such as V-Count Nano AI are mounted above entrances and count entries and exits as they happen. Off-site, location data providers collect location signals from a panel of mobile devices, assign them to places and extrapolate the result to estimate total visits.
Is mobile location data accurate for store visits?
It is an estimate. Location data is modelled from the devices in a provider’s panel, so accuracy depends on sample size, location precision and the provider’s method. It can be hard to separate neighbouring stores in malls or multi-tenant buildings. Sensors count the actual entrance, with V-Count Nano AI stating up to 99% accuracy under suitable conditions.
Can I see competitor foot traffic?
Only with location data. Sensors count the places where you install them, so they measure your own stores. Location data providers can estimate visits to any mapped location, including competitors, which makes them useful for market and site-selection analysis.
Which is better for measuring store conversion?
On-site sensors. Conversion needs visits matched with transactions by store and hour. Sensors record every entry at your own entrances, exclude staff and connect to POS. V-Count BoostBI has native Shopify and Nebim connectors and an open REST API.
Can sensors and location data be used together?
Yes. Many teams use sensors for exact counts and conversion in their own stores, and location data for wider questions such as trade-area reach, competitor visits and new-site selection. Use one consistent definition of a visit when comparing the two.
How much do foot traffic sensors cost?
V-Count Nano sensors cost US$299–799 per sensor, one-time, and BoostBI analytics cost US$9–49 per sensor per month. The number of entrances and selected features determine the total.
Keep exploring